Last updated: October 2026. Written by Tim du Toit, 39 years investing since 1987, founder of Quant Investing.
Ian Wright, a UK subscriber, watched a Youtube interview, read a transcript and asked Claude (also works with ChatGPT) one question. A few rounds later he had a stock screen he can run again any time he likes.
Below is how he did it, the screen re-run on today's data, and prompts to do the same with any book or interview you find.
Please remember everything here is general research from the screener, not personalised advice.
The short answer:
Ian Wright, a UK subscriber, gave Claude (or ChatGPT) the transcript of an August 2026 Excess Returns interview with Ian Cassel and asked one question: can this be turned into a screen? Over several rounds he refined Claude's rough first answer into a reusable prompt, now version 1.6. It turns Cassel's survival tests, plus an accounting check, into five screener rules. Re-run on 16 October 2026, it found 8 UK microcaps out of 245.
- 245 London-listed companies are worth £15m to £250m and trade at least £15,000 a day. 8 of them (3.3%) passed all five rules on 16 October 2026.
- Of Cassel's five tests, as Ian Wright reported them, 3 can be screened in full, 1 in part, and 1 (management quality) not at all.
- 4 of the 8 matches have a clean Beneish M-Score. 2 sit in the grey zone and 2 are flagged for a closer look at the accounts.
- The same prompt, adapted to Europe including the UK and run in euro, found 18 names. A US version found 4.
What did Ian want to find?
Small UK growth companies that can survive a bad patch and still grow through it.
The idea came from an August 2026 interview on the Excess Returns YouTube channel. In it, Ian Cassel outlines what Ian Wright describes as a 4-part company survival test from Cassel's new book, Stock Picker. Cassel's stated universe is global microcaps.
Ian's screen looks at London-listed companies worth £15m to £250m.
The problem Ian found: "able to grow through a recession" is easy to agree with and slow to check across 245 companies by hand.
In his own words: "Cassel’s criteria seemed largely screenable, and I wanted to see whether Claude + Quant Investing could produce a shortlist of UK microcap growth companies and save a lot of legwork. I treat it as a source of candidate ideas, not a buy list."
How did one question become a screen?
In Claude
(with the interview transcript attached)
Review the article and see if you can produce a search and or screen to identify these special Microcaps?
Claude
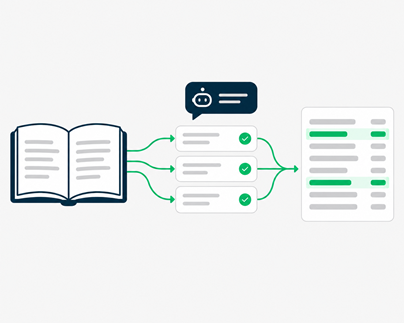
Read the YouTube transcript (can also be a PDF. a book, research paper or podcast transcript), picked out the criteria that can be measured, and returned a first rough screen on the Quant Investing database. Ian then refined it over several versions. Version 1.6 is the one below - Bottom of the article.
Ian's verdict on that process: "The interview and book rationale are largely qualitative, so Claude has done well turning Cassel’s principles into specific, testable metrics."
Here is how each test became a rule. The translation into numbers is Ian's and Claude's, not Ian Cassel's.
| Test (as Ian Wright reported it) | Rule Claude used | Why this rule |
|---|---|---|
| Balance sheet that survives | Altman Z-Score of 3 or more | Edward Altman (1968, New York University) built the score to predict bankruptcy. Above 2.99 is his safe zone. |
| Capacity for boldness | Debt to equity of 0.5 or less | Little debt leaves room to invest when competitors cannot. |
| Growth through recession | 5-year sales growth of 20% a year or more, checked against the latest year | Growth held for five years is harder to get by luck than one good year. The 1-year check shows if growth is Contracting / Steady / Accelerating / Decelerating. |
| Valuation that can double in 3 years | Only partly testable. Free cash flow (FCF) yield shown, not filtered on | Sales growth is not earnings growth, so no valuation cut-off was set yet. |
| Accounting quality (Ian's addition) | Piotroski F-Score of 5 or more, plus a Beneish M-Score warning flag | Joseph Piotroski (2000, University of Chicago) scored financial strength on 9 points. Messod Beneish (1999, Indiana University) built the M-Score to spot earnings manipulation. |
| Quality of senior management | Not screened | The screener holds no data on management track records. This one you check by hand. |
Principle against rule: Cassel's test asks if a company can survive a recession. The rule asks if its Altman Z-Score is above 3 today. You lose nuance and gain a test that runs on 245 companies in seconds. Read the Altman Z-Score definition and the Piotroski F-Score definition.
What did the screen find?
I re-ran version 1.6 (at the bottom of the article) exactly as Ian wrote it, with his default settings. Claude called list_columns to confirm all six factors exist, then screen_stocks twice: once for the universe count (245) and once with the rules (8 passed).
Screen output as at 16 October 2026. Not a recommendation.
| Company (ticker) | Market cap (GBP m) | Debt to equity | 5-year sales growth a year | Latest year sales growth | Growth trend | F-Score | FCF yield |
|---|---|---|---|---|---|---|---|
| Brave Bison Group (AIM:BBSN) | £89m | 0.10 | 29% | 108% | Accelerating | 5* | 6% |
| Made Tech Group (AIM:MTEC) | £75m | 0.04 | 29% | 27% | Steady | 7 | 7% |
| Beeks Financial Cloud Group (AIM:BKS) | £124m | 0.18 | 27% | 11% | Slowing | 5 | 2% |
| Serabi Gold (AIM:SRB) | £168m | 0.01 | 25% | 69% | Accelerating | 8 | 21% |
| EnSilica (AIM:ENSI) | £103m | 0.22 | 24% | 53% | Accelerating | 7 | 5% |
| Kooth (AIM:KOO) | £68m | 0.00 | 24% | -7% | Shrinking | 5 | 27% |
| Goldplat (AIM:GDP) | £35m | 0.02 | 22% | 11% | Slowing | 5 | 12% |
| Kromek Group (AIM:KMK) | £36m | 0.17 | 21% | 2% | Slowing | 5 | 6% |
Source: Quant Investing screener through the Claude connector, run 16 October 2026, prices to the close of 15 October 2026. Market cap in GBP. Sales growth and FCF yield rounded to the nearest whole %. All 8 passed: Altman Z-Score 3 or more, debt to equity 0.5 or less, 5-year sales growth 20% a year or more, F-Score 5 or more. * F-Score may rest on incomplete data.
General research, not personalised advice. These companies are screen output, not recommendations. Prices fluctuate and capital can be lost.
Beneish M-Score check. Flagged: Goldplat, Kromek. Grey zone: Brave Bison, Serabi Gold (close to the boundary, so a soft call). Clean: Made Tech, Beeks, EnSilica, Kooth. A flagged name stays on the list, with a note to read its accounts before anything else.
Growth trend. Three names are growing faster than their 5-year rate, one is steady and three are slowing. Kooth's sales fell 7% in the latest year. The company reported that a large California contract was tapering, so the drop has a named cause. Serabi Gold and Goldplat are gold producers, so part of their growth follows the gold price.
Turn the next book you read into a screen
Ian built this with the Quant Investing connector for Claude (also works with ChatGPT). Claude reads the screener database, runs the screen and explains the output. The connector comes only with the Best Deal subscription.
100% money-back guarantee for the first 30 days.
What else can you do with the same method?
If you already use the Quant Investing AI connector, copy any of these prompts into Claude / ChatGPT.
Start with Ian's own prompt at the bottom of this article It includes the Europe and US settings.
Turn any book, video, podcast, interview or article into a screen
I have attached [the transcript / article / my notes on the book].
1. List every investment criterion it describes.
2. For each one, say whether the Quant Investing screener can test it.
   Run list_columns to check the column exists before you use it.
3. Turn each testable criterion into a rule with a threshold, and
   explain why you chose that threshold.
4. List the criteria that cannot be screened, so I check them by hand.
5. Run the screen with screen_stocks on [market] and show the results
   in a table. Use the "%" sign. This is general research, not
   personalised advice.
Ask Claude / ChatGPT to audit and tighten a screen
Audit this screen prompt before I use it again.
Check every column with list_columns. Tell me how many companies each
rule removes on its own. Flag missing-data values (for example -999)
that could let a company slip through. Suggest the 3 changes that
would improve it most, and do not change anything until I agree.
Then re-run it and add sector, price to sales and price to earnings
as columns.
Audits like this took Ian's prompt through to version 1.6. One of them found that about 29% of the universe had a missing Beneish value, which is why the prompt now has a guard against it.
Try it yourself: run it for Europe or the US
For Europe I kept every rule and changed only the market: 19 countries including the UK, worth €18m to €300m and trading at least €18,000 a day (Ian's limits converted at 1.18 euro to the pound, rounded). It found 18 names. The top 5 by 5-year sales growth:
Screen output as at 16 October 2026. Not a recommendation.
| Company (ticker) | Country | Market cap (EUR m) | 5-year sales growth a year | F-Score | Beneish M-Score |
|---|---|---|---|---|---|
| AltynGold (LSE:ALTN) | United Kingdom | €297m | 38% | 7 | Flagged |
| Spyrosoft (WSE:SPR) | Poland | €81m | 34% | 6 | Grey zone |
| Hove (CPSE:HOVE) | Denmark | €23m | 31% | 5 | Grey zone (close to boundary) |
| EVS Broadcast Equipment (ENXTBR:EVS) | Belgium | €259m | 31% | 5 | Clean |
| Profile Systems & Software (ATSE:PROF) | Greece | €259m | 30% | 6 | Grey zone (close to boundary) |
Source: Quant Investing screener through the Claude connector, run 16 October 2026. Market cap in EUR. 9 of the 18 matches are UK companies, the 8 above plus AltynGold, which is too large for the sterling version. General research, not personalised advice.
For the US I changed the market to companies listed on the NYSE, Nasdaq and NYSE American, worth $20m to $330m and trading at least $20,000 a day (converted at 1.33 dollars to the pound). Same rules. It found 4 names on 16 October 2026: Nano Dimension, Crexendo, Smart Sand and Comstock Holding.
Run the attached QI Cassel UK Microcap Growth Screen v1.6 with every
rule unchanged, but for [Europe including the UK / US-listed companies].
Use market cap [EUR 18m to 300m / USD 20m to 330m] and at least
[EUR 18k / USD 20k] traded a day. For the US, use the NYSE, Nasdaq
and NYSE American exchanges. Show the universe count first, then
the matches with the Beneish M-Score tier for each.
Keep the list and review it every week
Add the names you want to follow to a watchlist in the screener. Then the weekly portfolio review with Claude tells you every Monday what moved and why.
What this screen cannot do
It cannot judge management. Ian is clear on this: "Cassel’s other test, the quality of the senior management, can’t be screened and has to be checked separately." Read the annual reports and the director share dealings.
It only partly tests valuation. Fast sales growth says nothing about the price you pay. FCF yield is shown, and nothing is filtered out on price.
The data has a date on it. Ratios come from each company's latest accounts, here dated December 2025 to June 2026. New results can move a name in or out.
Microcaps are hard to trade. At £15,000 a day, small orders can move the price.
It has not been back-tested.
The output is general research, not personalised advice, and takes no account of your circumstances. Prices fluctuate and capital can be lost. We work on a 12-month horizon on every idea we publish, and past performance is no guarantee of future results.
How do I get the connector?
The Claude / ChatGPT connector comes with the Best Deal subscription: €79.70 a month, or €779.70 a year (€64.98 a month). It is the only plan that includes all four: the Screener, the Quant Value newsletter, the Shareholder Yield Letter and the Claude connector with its 32 tools.
Setup is a quick one-time job. The step-by-step guide is here: how to connect Claude to Quant Investing.
If you change your mind, you can disconnect it in about 30 seconds (Settings, Connectors, Remove). Nothing is installed on your computer.
Build your own screen from the next interview you watch
Best Deal gives you the screener, both newsletters and the Claude / ChatGPT connector in one subscription, so the book on your desk can become a screen you run every month.
Compare subscription options and prices
100% money-back guarantee for the first 30 days.
Already a Quant Investing subscriber? Upgrade to Best Deal and we refund the unused portion of your current subscription. No double-charge.
Frequently asked questions
Which subscription do I need?
Best Deal, at €79.70 a month or €779.70 a year (€64.98 a month). It is the only plan that includes the Claude / ChatGPT connector, the Screener, Quant Value and the Shareholder Yield Letter. See the subscription options.
Can I use Ian's screen prompt?
Yes. Ian allowed us to share it. Copy the prompt at the end of this article and paste it into Claude / ChatGPT. It includes the Europe and US settings.
Does it work outside the UK?
Yes. On 16 October 2026 the Europe version found 18 names and the US version found 4.
Can I backtest it?
You can backtest it yourself with by simply saving the screen, then asking Claude / ChatGPT to back test the saved screen and to give you the results in your currency including maximum drawdowns. Backtest history starts in 2016.
Do I need a paid Claude plan?
Works on Claude’s free plan as it allows one connector.
Did Ian Cassel design this screen?
No. Ian Wright built it with Claude / ChatGPT from an interview in which Ian Cassel described his survival test. The rules and thresholds are Ian Wright's and Claude's translation, not Cassel's. Nothing here implies that Cassel endorses the screen or Quant Investing.
Is this investment advice?
No. It returns general information from the screener and knows nothing about your circumstances. The names are screen output, not recommendations.
Where can I find more prompts?
The command library lists the queries subscribers use most: Quant Investing MCP commands.
Ian's screen prompt to copy
Copy the prompt below and paste it into Claude / ChatGPT with the Quant Investing connector switched on. It is a short version of Ian's version 1.6, with the same rules. The rules are Ian's and Claude's translation of the test Ian Cassel describes, not Cassel's own.
Do not worry if this looks technical, Ian prompted Claude in plain simple English and Claude wrote this prompt for him.
The output is general research, not personalised advice and not a buy list.
QI Cassel UK Microcap Growth Screen v1.6 (short version)
Built by Ian Wright, UK subscriber, with Claude and the Quant Investing
connector.

Use the Quant Investing connector. Run list_columns first to confirm
every column below exists.

1. Universe count. Call screen_stocks with only these settings and
   columns ["ticker"]. The number of rows is the universe.
   exchanges: ["LSE"]
   market_cap_currency: "GBP", min_market_cap: 15, max_market_cap: 250
   daily_trading_volume_currency: "GBP", min_daily_trading_volume: 15

2. Screen. Same settings, plus:
   filters: z_score gte 3, debt_to_equity lte 0.5,
            cagr_5yr_sales gte 0.20,
            PROBM gt -50 (this removes the -999 missing-data value)
   post_filters: f_score gte 5
   columns: ticker, name, market_value_corporated_in_GBP,
            debt_to_equity, cagr_5yr_sales, year_growth_sales,
            f_score, f_score_missing, fcf_yield, PROBM

3. For each match:
   - Growth trend, checked in this order: Contracting if 1-year sales
     growth is negative. Steady if 1-year and 5-year growth are within
     5 points. Accelerating if 1-year is more than 5 points above
     5-year. Decelerating if it is more than 5 points below.
   - Beneish M-Score tier: Clean below -2.22, Gray from -2.22 to -1.78,
     Flagged above -1.78. Mark values within 0.02 of a boundary as
     boundary-close. A Flagged name stays on the list, but its
     accounts need a check first.
   - If f_score_missing = 1, keep the name and flag it.
   - Exclude names with no z_score, f_score or PROBM value.
   - For a Contracting name, search for the reason and name it.

4. Output:
   - One header line: run date, settings, universe count, matches.
   - A table: ticker, name, market cap (GBP m), debt to equity,
     5-year sales growth, 1-year sales growth, growth trend, F-Score,
     FCF yield. Round to whole numbers and use the % sign. Call out
     any negative or very large FCF yield.
   - The Beneish tier list under the table.
   - This footer: "Management quality not tested. Not back-tested.
     General research, not personalised advice."

Other markets: keep every rule and change only step 1.
   Europe including the UK: countries ["United Kingdom", "Ireland",
   "Germany", "France", "Netherlands", "Belgium", "Luxembourg",
   "Italy", "Spain", "Portugal", "Austria", "Switzerland", "Sweden",
   "Norway", "Denmark", "Finland", "Iceland", "Poland", "Greece"],
   currency "EUR", market cap 18 to 300, trading volume 18.
   US: exchanges ["NYSE", "NASDAQ", "AMEX"], currency "USD",
   market cap 20 to 330, trading volume 20.
About the author. Tim du Toit has invested for 39 years (since 1987) and is the founder of Quant Investing. He is the author of Quantitative Value Investing in Europe: What Works for Achieving Alpha, a 12-year study (1999 to 2011) of 168 investment strategies across European markets, and writes the Quant Value newsletter, live since 2009.
Disclosure: at the time of writing, the editorial team holds none of the companies named in this article.
This article is general information and commentary published to a broad audience. It is not personalised investment advice and takes no account of your circumstances. Prices fluctuate and capital can be lost. Past performance is no guarantee of future results. See our full disclaimer.