
Do you know that the Piotroski F-Score can improve your investment strategy?
Yes I am really talking about your investment strategy and not just a low price to book strategy as Professor Joseph Piotroski successfully proved in his 2000 research paper "Value Investing: The Use of Historical Financial Statement Information to Separate Winners from Losers".
How to improve your investment strategy
In this article I show you, through back tests, what other investment strategies we improved with the use of the Piotroski F-Score. When you have seen the evidence I am sure you will agree that it can also improve your investment strategy.
Piotroski F-Score helps growth strategies
For example, a good friend of mine, in his master's thesis, found that companies with a good Piotroski F-Score can substantially increase the returns of a growth investment strategy. You can find out more by clicking on the following link: Use the Piotroski F-Score to improve Growth Investment Returns.
More on the Piotroski F-Score
I am not going to include it here but if you want more information about the Piotroski F-Score, including how it is calculated take a look at this article: This academic can help you make better investment decisions – Piotroski F-Score.
The back test
In the research paper Quantitative Value Investing in Europe: What Works for Achieving Alpha we tested 168 different investment strategies, on companies in the Eurozone, to find what strategies would have given you the best returns over the 12-year period from 13 June 1999 to 13 June 2011.
In spite of the test period being quite short it was most certainly not a good time to be invested in the stock market, as it included the internet stock market bubble (1999), two recessions (2001, 2008-2009) and two bear markets (2001-2003, 2007-2009).
One remarkable finding
In spite of the Piotroski F-Score being an indicator that helps you find companies improving fundamentals (it can’t tell you if a company is undervalued) if you used it as a single factor to select investment ideas you would have done surprisingly well.
The Piotroski F-Score was the fifth best single factor strategy we tested. The following table shows you what your returns you could have earned if you used only the Piotroski F-Score to get investment ideas.
| Strategy | F-Score | ||||
|---|---|---|---|---|---|
| Total Return 13/06/1999–13/06/2011 | |||||
| Market Cap | Q1 | Q2 | Q3 | Q4 | Q5 |
| SMALL CAP (> 15 m and < 100m) | 205.1% | 36.7% | −6.6% | −41.9% | −55.0% |
| MID CAP (> 100 m and < 1000 m) | 301.7% | 82.7% | 58.0% | 3.0% | −54.6% |
| LARGE CAP (> 1000 m) | 144.3% | 77.1% | 95.7% | 61.3% | 20.6% |
Source: Quantitative Value Investing in Europe: What Works for Achieving Alpha
Q1 was companies with the best (high) Piotroski F-Score and Q5 companies with the worst (lowest) F-Score.
Market only returned 30.5%
For all company sizes the companies with the best F-Score substantially beat the market which over the 12-year period of the study returned 30.54 % or 2.25% pa, dividends included.
Piotroski F-Score with other ratios improved returns over 200%
We also tested the Piotroski F-Score with 13 other ratios and indicators to see if it could not have increased your returns.
What we found was close to unbelievable!
With the exception of two other ratios (ROIC and Net Debt on Market Value), combining the F-Score with another ratio would have given you a lot higher returns.
The following table shows you how much the return of the stand-alone strategies were improved by selecting only companies with a good Piotroski F-Score.
| Investment Strategy | Stand-alone Strategy | Combined with the F-Score | Improvement |
|---|---|---|---|
| Earnings Yield 12 months | 235.7% | 448.7% | 213.1% |
| Earnings Yield 5 years | 291.1% | 457.4% | 166.3% |
| Price To Book | 400.3% | 591.2% | 191.0% |
| FCF Yield | 317.4% | 680.4% | 363.0% |
| FCF Yield 5 years | 325.8% | 391.4% | 65.6% |
| Price To Sales | 191.2% | 455.5% | 264.2% |
| Net Debt On Market Value | −13.6% | 224.9% | 238.5% |
| ROIC | 82.6% | 232.7% | 150.1% |
| ROIC 5 years | 134.2% | 329.6% | 195.4% |
| Price Index 12 months | 159.6% | 477.7% | 318.1% |
| Price Index 6 months | 248.0% | 393.3% | 145.3% |
| MF Rank | 182.8% | 340.9% | 158.1% |
| ERP5 | 279.8% | 549.3% | 269.5% |
| Average | 218.1% | 428.7% | 210.6% |
Source: Quantitative Value Investing in Europe: What Works for Achieving Alpha
Best stand-alone strategy = Price to book +400.3%
As you can see in the Stand-alone strategy column price to book was the best stand-alone strategy you could have used over the period.
This may have been because the test period contained two market crashes (internet bubble and the 2008 financial crisis) after which a low price to book strategy usually does very well.
However, be careful of a low price to book investment strategy because it has long periods of market underperformance. You can read more about it here: Be careful of this time tested value ratio
Best strategy with Piotroski F-Score = Free cash flow yield (FCF Yield) +680.4%
The strategy combined with the best Piotroski F-Score companies that gave the best returns over the 12 year period was FCF Yield which returned just over 680%.
Not bad, I am sure you will agree.
Most improved strategy = Free Cash Flow Yield +363%
The Piotroski F-Score was able to add 363% to the return of a strategy of buying only the companies with the highest FCF Yield.
The second most improved strategy was Price Index 12 months (EBIT/Enterprise Value) which the Piotroski F-Score improved 318.1% from 159.6% to 477.7%.
As you can see all the returns were a lot better as on average the returns of all 13 ratios or strategies increased 210.6% over 12 years, that’s a huge improvement!
See the high F-Score companies from a year ago
Your free demo loads the Piotroski F-Score as a pre-built ranking factor across 22,000+ stocks worldwide. Sort it high to low and the companies scoring 8 or 9 at the top are the financially strongest names the screener flagged twelve months ago — the same quality filter this article combined with Free Cash Flow Yield and Price to Book. Because the demo runs on data from a year ago, you are looking at exactly what a high-quality screen would have picked back then.
Sort stocks by Piotroski F-Score
No credit card needed. Cancels automatically after 30 days.
Adding quality can substantially increase your returns
Thus adding a quality indicator, which the Piotroski F-Score really is, to your investment strategy or screen can increase your returns substantially.
The Piotroski F-Score, if you look at the way that the nine ratios it consists of are calculated, helps you add companies with good fundamental momentum to your portfolio.
And that's where its real value lies.
How to add the Piotroski F-Score to your screens
In the stock screener it's really easy to add the F-Score to how you search for investment ideas.
Add it with the slider
You can add the Piotroski F-Score by using one of the four sliders as the following screenshot shows.
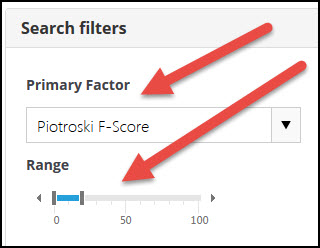
Select Piotroski F-Score from the Primary Factor drop down list under the Quality heading.
To select only the companies with the best (highest) F-Score move the slider to that you select 0% to 20% of the Piotroski F-Score values.
Or use filter
Or you can select the best Piotroski F-Score companies by using the filter function in one of the columns.
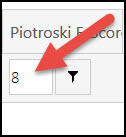
To do this first type the number 8 in the field next to the small funnel.
Then click on the small funnel image and select GreaterThan.
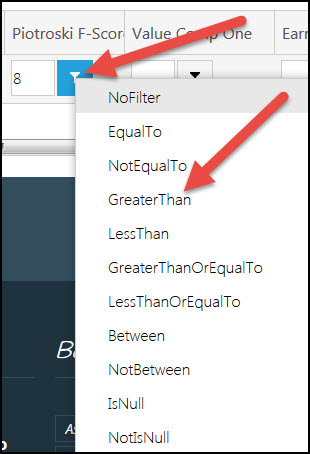
It’s as easy as that to add the Piotroski F-Score to the way you search for investment ideas.
You can get more information on the screener here: Quant-Investing screener
Summary and conclusion
You can increase your returns substantially by adding only companies with a high (good) Piotroski F-Score to your existing investment strategy.
As you saw it increased the returns of 13 investment strategies by an average of over 210% over a 12 year period.
Test the Piotroski F-Score yourself in five minutes
The demo runs on data from a year ago, so it shows you the companies that had a high Piotroski F-Score of 8 or 9 twelve months ago — and the weak ones scoring 0 to 2. Add Free Cash Flow Yield or Price to Book as a second factor to mirror the winning combinations in this article. Pick any five of the high-score names, look up today's prices, and you have run a real one-year forward test of the quality filter yourself — did the strong companies hold up and the weak ones lag? No back-test software needed.
No credit card needed. Cancels automatically after 30 days.
Want today's F-Scores next to today's prices instead of the demo's year-old data? Subscribe direct — the screener updates every day, with a 100% money-back guarantee for the first 30 days. See subscription options →
Another interesting Piotroski F-Score articles
Here are another interesting article on the Piotroski F-Score:
This academic can help you make better investment decisions – Piotroski F-Score
Can you use the Piotroski F-Score to improve Growth Investment Returns?
Use the Piotroski F-Score to seriously improve your returns
Ever thought of using a fundamental stop-loss?
Webinar - How to increase your returns on average 210.6% (max 363.0%) – Piotroski F-Score