

This article shows you our best ideas on how you can make the most of a market crash. In other words how can you find the best investment ideas when the stock market crashes.
In a lot of cases multiple times your investment – a multi-bagger as it is also know.
Each crash is different
Each market crash is different. Each has a different cause, different assets were overvalued and different companies are the hardest hit. But they all have one thing in common, a LOT lower stock prices.
Sometimes the fall in prices will make sense, for example if a specific industry is directly hit, other times they don't.
It is your job to make sense of these wild movements and select the best ideas so you can profit from it. And this is where these stock screens can help you.
Be careful of your emotions
One more thing before I get to the how-to part. If you are invested, even in great companies you want to hold long-term, larger losses create emotional stress. This is a fact of life, its simply human.
To counter this you should only take as much risk as you feel comfortable with. If you take on too much risk it may lead to you selling out at the worst possible time, most likely right at the bottom of the market. This is the worst thing you can do because it removes any chance of recovering your capital.
Enough of an introduction this is how you can find the best investment ideas.
Net-net investments – Buy at less than liquidation value
The net-net investment strategy was developed by Benjamin Graham, the father of value investing.
The idea of the strategy is to buy companies trading at less than their liquidation value. Companies trading at such a low price that you could buy the whole company, sell off all the assets, pay off all liabilities and still make a profit.
You thus want to find companies with a market value less than their net-net working capital (this is where the name net-net investment strategy comes from).
What is Net-net working capital
Net-net working capital is defined as: (Cash and short-term investments + (75% of accounts receivable) + (50% of inventory) - All Liabilities)
Net-Net back test
We summarised a few back tests of the net-net investment strategy here: Why and how to implement a net-net investment strategy world-wide
Here are the main points:
- Returns are safe from big institutional investors because these are mainly small companies
- Strategy has shown to produce 20 - 30% annual returns
- Create a buffer by investing in only stocks with NVAC 1.5 times above market cap of the firm
- Re-balance yearly or less to keep transaction costs incl. bid ask spreads low
- The strategy invest in under the radar net-net firms without any analyst coverage
- If possible, invest in net-net stocks when forward earnings yield of S&P 500 is higher than long term bond yield
- Net-net strategy also works outside of the United States
You must buy a basket- 30 companies
As you can imagine there is a good reason why companies get this undervalued.
If you look at the list of investment ideas the net-net screen comes up with you will see that these are companies that have problems – most likely BIG problems.
This is why Benjamin Graham suggested that you lower your risk by investing in a number of net-net investments, he suggested that you invest in basket of 30 such ideas to lower the risk of any one company (or a few) going bankrupt.
The idea is that other companies in the basket will do so well, more than compensating for the few companies that go bankrupt.
Net-nets in the stock screener
In the Quant investing stock screener we define Net Current Asset Value (NCAV) as follows:
Net Current Assets Value (NCAV) = (Current assets (cash, inventories and accounts receivable) – All possible Liabilities) / Market value
With all possible liabilities calculated as (Total Assets - Common Shareholders Equity)
Your margin of safety
As you can see in the above ratio calculation nothing is done to lower the value of inventory or accounts receivable as Benjamin Graham suggested.
NCAV > 1.5
To make up for this make sure that the companies the screen selects has a net current asset value ratio of more than 1.5.
This means that all the companies the screener selects have net assets (after all liabilities have been deducted) worth at least 1.5 the current market value of the company.
To start finding net-net ideas for your portfolio now - Click here
How to find net-net investment ideas with the screener
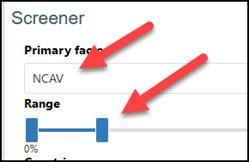
Step 1 – Use NCAV in the Primary slider
Select the cheapest companies in terms of NCAV
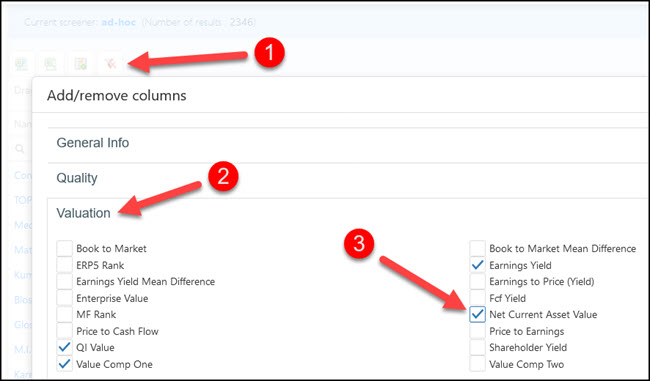
Step 2 – Add Net Current Asset Value as an output column
Click the Add/remove Columns button, click on the Valuation tab and tick the box next to Net Current Asset Value.
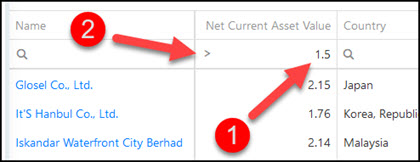
Step 3 – Filter for companies with a Net Current Asset Value of greater than 1.5
To do this type 1.5 into the box below theNet Current Asset Value column heading. Then click on thesmall magnifying glass icon and select the > Greater than sign.
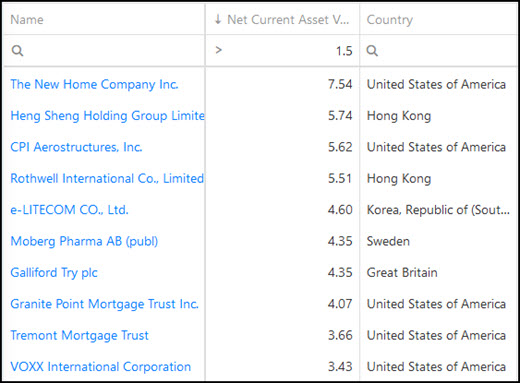
First 10 net-net investment ideas
For example, below is a list of 10 net-net ideas sorted from high to low (click the column heading twice to sort) by net current asset value (NCAV):
How to select quality Net-nets
As I mentioned a net-net company is usually a low quality business. You can however improve the quality of your net-net ideas by using the Piotroski F-Score.
You can find more information on the Piotroski F-Score here: This academic can help you make better investment decisions – Piotroski F-Score
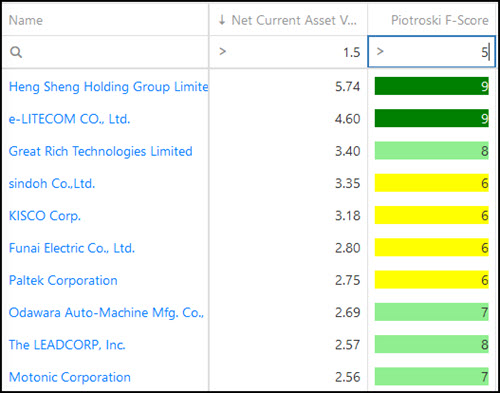
If you use the above list but remove all companies with a Piotroski F-Score of less than 5 (Piotroski F-Score values go from 0 to 9) the list of investment ideas look like this:
Net-net with positive free cash flow
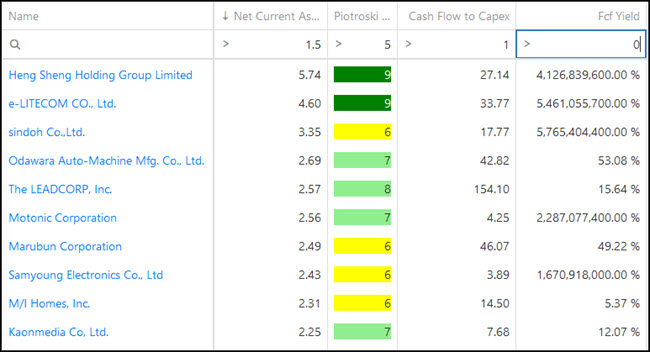
If you want to screen out companies that are burning cash (this decreased NCAV over time) you can do this by selecting net-nets with a cash flow to capital expenditure ratio greater than 1. (Cash flow to Capex = Cash from Operations / Capex)
This will make sure the company has been able to meet all its capital expenditure with cash flow generated by the business, or you can say the company has positive free cash flow.
If you do this only one company remains on the net-net list:
You need to do some research
Please remember, as with all screens, the names the screener comes up with should just be the start of your research process.
And because net-nets are high risk investment ideas further detailed research is important.
To start finding net-net ideas for your portfolio now - Click here
Negative enterprise value companies – More cash than market value and debt
Looking for negative enterprise value companies is another great strategy to use in a crash.
For a company to have a negative enterprise value it has to have more cash than its market value and debt. This means it is likely that the company is very undervalued.
Before I show you how to find negative enterprise value companies first some information on how enterprise value is calculated.
How is enterprise value calculated?
In the Quant Investing stock screener Enterprise value is calculated as = the current market value of the company (market capitalisation) + Long-Term Debt + Minority Interest + Preferred capital - Excess Cash.
Excess cash is the amount of cash in excess of what the company needs to run its business, in other words cash that can be paid out to investors without harming the business.
Excess cash is calculated as follows:
If Total Current Assets are greater than (2 x Total Current Liabilities), then Excess Cash is the lower of:
- Cash and Short Term Investments or
- Total Current Assets - (2 * Total Current Liabilities).
If Current Assets are not greater than (2 x Total Current Liabilities) then Excess cash is 0.
An example
For example let’s assume a company’s Current Assets minus two times its Current Liabilities are €1000 and its Cash and Short Term investments equal €500. You can see it has excess cash because Current assets are larger than two times current liabilities. Excess cash is thus €500, the lower of €1000 and €500.
Where does this excess cash formula come from?
Joel Greenblatt on his Magic Formula Investing website said only excess must be deducted in the Enterprise Value formula.
This makes sense as I am sure you will agree that a business cannot pay out all the cash on its balance sheet but only the amount more than it needs to run its business.
Unfortunately Joel does not mention how he calculates excess cash.
We went back to Benjamin Graham
We thus decided to use one of Benjamin Graham’s margin of safety rule he wrote about in his book The Intelligent Investor which says:
“Invest only in companies where the current ratio (Current assets / Current Liabilities) is more than 1.5.”
We increased this ratio to two before assuming a company has excess cash on its balance sheet. So as you can see a very conservative calculation.
To start finding negative EV companies for your portfolio now - Click here
How to find negative enterprise value companies
The Quant Investing stock screener makes it very easy to find negative enterprise value companies. We have already saved a screen you can load with only a few mouse clicks.
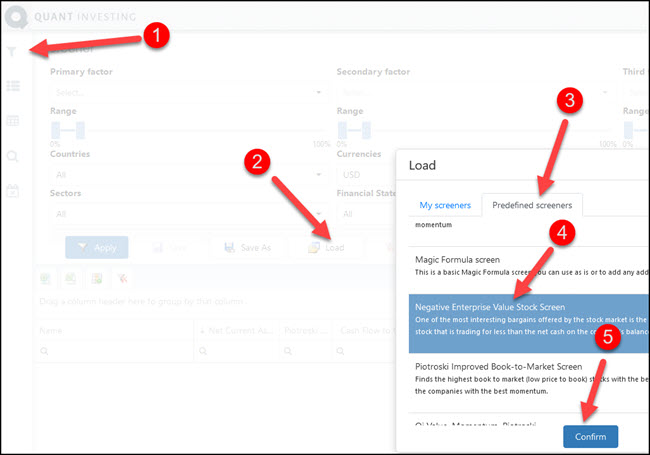
Once you have logged in and opened the screener it’s easy to load the screen. This is how you do it:
- Click on top left Funnel icon to open the screener filters
- Then click on Load button to load a saved screen
- Click the Predefined screeners tab
- Scroll down the list until you find the Negative Enterprise Value Stock Screen – click on the name to select it.
- Click on the Confirm button load the screen
When you load the screen you will see that the screener automatically loads the Enterprise Value column.
To find negative enterprise value companies:
- Enter a 0 in the field below the Enterprise Value column heading
- Click on the magnifying glass icon and select the < Less than sign
Your negative enterprise value screen
It is that easy to get your list of negative enterprise value companies.
Refine your settings
You can further refine the results with the following settings:
- Select only the countries where you invest
- Increase the quality of the companies using the Piotroski F-Score (> 5 for example)
- Include only liquid companies using Daily Trading Volume or Market Value
To start finding negative EV companies for your portfolio now - Click here
How to find undervalued quality companies
The previous two strategies were deep value strategies. They have great returns but it’s not the kind of strategy I would put most of my money in during a crash.
As I mentioned both are basket strategies where you need to buy at least 30 companies as a lot of companies may go bankrupt. In spite of that they are still great overall strategies.
Now let’s look at how to find great quality companies that are undervalued.
The best ratios to use
Before you get to the actual screens here are the ratios I recommend you use.
You can see all the other ratios and indicators included in the screener here: Screener Glossary
Value Composite Two
Value Composite Two (VC2) is a combined valuation indicator that combines the following valuation ratios into a single valuation indicator:
- Price to book value
- Price to sales
- Earnings before interest, taxes, depreciation and amortization (EBITDA) to Enterprise value (EV)
- Price to cash flow
- Price to earnings
- Shareholder Yield
Value Composite Two is a great valuation ratio to use as it lets you find undervalued companies from different valuation angles. For example book value, cash flow, net profit and operating profit.
You can read more about VC2 here: How and why to implement a Value Composite Two investment strategy world-wide
To find Quality Undervalued companies for your portfolio now - Click here
Qi Value
Qi Value is also a ranking value that also uses a combination of the best valuation ratios we have tested.
It ranks the whole universe of companies in the screener using the following four valuation ratios:
- EBITDA Yield
- Earnings Yield
- FCF Yield
- Liquidity (Qi)
The main difference between Qi Value and VC2 is that VC2 included price to book and Qi Value includes the Liquidity Qi ratio.
You can read more about Qi Value and Liquidity Qi here:
Qi Value investment strategy back test
This investment strategy is working even better than we expected +711%
Liquidity (Qi.) indicator finds neglected (mis-priced) companies
How to find cheap companies that will survive
Using the above two ratios to find cheap companies is only half of what you want to do. You also want to make sure that these companies have the financial strength to survive a possible slowdown after a market crash.
We suggest you use the following ratios and indicators to find quality companies
Piotroski F-Score
The Piotroski F-Score is a great indicator you can use to find companies with positive financial momentum.
Take a look at the following articles to see how the F-Score is calculated as well as how well it works:
This academic can help you make better investment decisions – PiotroskiF-Score
Can the Piotroski F-Score also improve your investment strategy?
Gross Margin (Marx)
This is the best quality ratio we have tested by far.
The Gross Margin (Marx) is calculated as: Gross Profits (sales minus cost of goods sold) / total assets (depreciation deducted)
You can read more about the Novy-Marx high gross income ratio here: Have you been using the wrong quality ratio?
Debt to Equity
You want to make sure the company does not have a lot of debt to do this use the Debt to Equity ratio
Debt to Free Cash Flow
You also want to make sure a company generates enough Free Cash Flow to be able to pay back its debt. Do this by using the Debt to Free Cash Flow ratio.
Net Debt to EBIT
Net Debt to EBIT is a conservative ratio (it uses EBIT not EBITDA) to make sure a company can pay back its debts through the profits the business makes.
Use it to remove the lowest quality companies from your screen.
To find Quality Undervalued companies for your portfolio now - Click here
A few example stock screens
Using the above mentioned ratios here are a few screen suggestions and the companies it came up with.
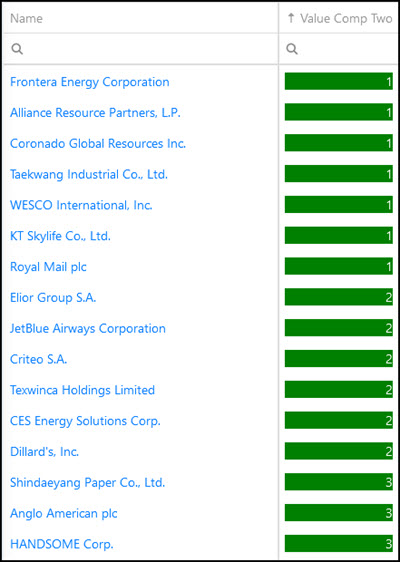
Quality Value Composite 2 screen
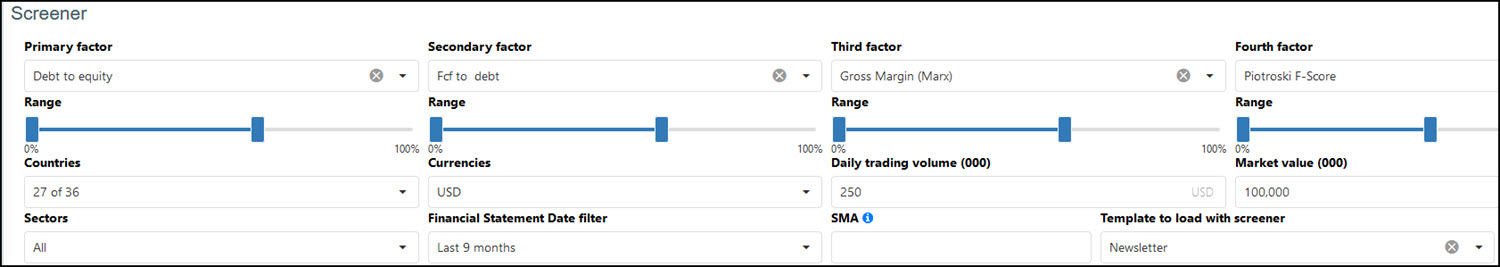
This is what screen looks like:
- All the main developed markets worldwide
- Financial statements updated in the past 9 months
- Minimum average 30 day daily trading value of USD 250,000
- Minimum market value of USD 100 million
- 60% of companies with the lowest Debt to Equity ratio
- 60% of companies with the highest Free Cash Flow to Debt ratio
- 60% of companies with the highest Gross Margin (Marx)
- Companies with a Piotroski F-Score greater than 5
- Sort the list by Value Composite 2 from low to high (the lower the more undervalued the company is)
This is what the screen looks like:
Click image to enlarge
Here is an example of the top companies in the screen:
To find Quality Undervalued companies for your portfolio now - Click here
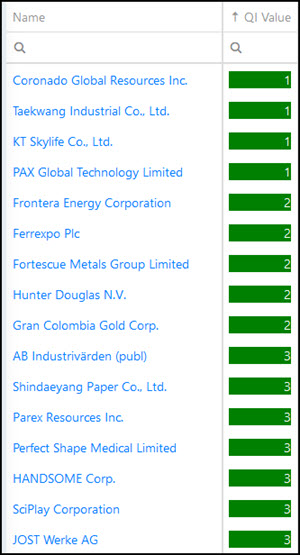
Quality Qi Value screen
This screen uses Qi Value instead of Value Composite 2 to value companies.
As mentioned the main difference is that Qi Value does not use price to book and incudes the Liquidity Qi ratio – which looks for less liquid companies.
You will see that the list of companies is very similar. As with a lot of similar screens – in this case Quality Undervalued companies – a lot of roads all lead to Rome, or the same companies.
This is what screen looks like:
- All the main developed markets worldwide
- Financial statements updated in the past 9 months
- Minimum average 30 day daily trading value of USD 250,000
- Minimum market value of USD 100 million
- 60% of companies with the lowest Debt to Equity ratio
- 60% of companies with the highest Free Cash Flow to Debt ratio
- 60% of companies with the highest Gross Margin (Marx)
- Companies with a Piotroski F-Score greater than 5
- Sort the list by Qi Value from low to high (the lower the more undervalued the company is)
This is what the screen looks like:
Click image to enlarge
Here are the top companies in the screen:
To find Quality Undervalued companies for your portfolio now - Click here
Four great strategies to use in a market crisis
I hope you have found the strategies helpful. They are the best ideas we have to give you great investment ideas to profit from a market crash.
PS To get all the tools you need to implement these strategies in your portfolio sign up here .
PPS It’s so easy to put things off and forget, why not sign up right now?
To find Quality Undervalued companies for your portfolio now - Click here
