

Last updated: April 2026
By Tim du Toit — 39 years of quantitative investing experience, author of Quantitative Value Investing in Europe: What Works for Achieving Alpha
Discover how you can REALLY increase your investment returns by using a "Net-Net" strategy. This post explains why investing in companies trading below their liquidation value can lead to big profits.
You’ll learn how to find these hidden gems worldwide, avoid common pitfalls, and confidently add them to your portfolio. By the end, you'll have practical steps to start implementing this powerful strategy today.
Whether you're a seasoned investor or just starting out, this guide will help you make smarter, more profitable investment decisions.
Estimated Reading Time: 7 minutes
If you have found this article you have most likely heard of the net net investment strategy developed by Benjamin Graham, the father of value investing. It is also the strategy Warren Buffett used when he started out investing.
Net-Net investment strategy — definition:
A deep value strategy developed by Benjamin Graham that buys stocks trading below their net current asset value (NCAV). NCAV = Cash + (75% × accounts receivable) + (50% × inventory) − all liabilities. A stock qualifies as a net-net when its market price is less than 2/3 of NCAV, meaning you could theoretically liquidate the company and still profit.
Key findings from 4 independent research studies:
- Net-net stocks returned 2.55% per month vs 0.85% for the NYSE-AMEX Small Cap Index (Oppenheimer, 1984–2008)
- 22.4% annual outperformance over the NYSE-AMEX index across a 24-year period
- UK study (London Stock Exchange, 1981–2005): net-nets returned 31.19% per year vs 20.51% for the market index
- Portfolio with $5/share price filter returned 6.01% per month — over 7× the S&P 500's 0.78% (Vu et al., 1975–2010)
- Strategy is protected from institutional investors: net-net companies are too small for large funds to use
Find companies below liquidation value
The idea of the strategy is to find companies trading for less than their liquidation value. This means, companies trading at such a low price that you could buy the whole company, sell off all the assets, pay off all liabilities and still make a profit.
You thus want to find companies with a market value less than its net-net working capital (this is where the name net net strategy comes from).
Net-net working capital is defined as: (Cash and short-term investments + (75% of accounts receivable) + (50% of inventory) - All Liabilities)
Very conservative
As you can see the net-net formula is very conservative as it assumes only half of the value of inventory and 25% of accounts receivables will not be collected.
Does a net-net strategy work?
This sounds great you may be thinking, but does the strategy really work - over long periods of time in up and down markets?
Many independent research reports have found that a net net strategy generates great returns: about 20-30% returns per year. A great thing for small investors like me and you is that these returns are protected from big institutional investors.
Why your net-net strategy is safe from big investors
The companies selling below their liquidation values are simply too few and are too small to make a difference in the returns of large funds so they are ignored.
Now that we know our investment strategy will be safe from Wall Street, let's look at the results you can expect from becoming a net net hunter.
Net-Net Research paper #1
This research paper proves that a net-net investment strategy works great for the small investor.
In a paper called “Ben Graham's Net-nets: Seventy-Five Years Old and Outperforming”, three researchers tested the net net strategy over the 24 year period from 1984 - 2008.
How they defined a net-net stock
The authors defined a net-net stocks as companies that are selling below 2/3 of Net Current Asset Value (NCAV = current assets - [liabilities + preferred stock]).
Details of the back test
The investment universe began with all stocks listed on the NYSE, AMEX, and the NASDAQ. The stocks were then filtered for deep value based on having a market price of 2/3 or less of NCAV.
The number of net net stocks every year varied. There were only 13 stocks selling for 2/3 or less of NCAV on 1984, while there were 152 such stocks in 2002.
The equal-weighted portfolio assumed all net net stocks were bought on December 31 and sold after one year. Re-balancing once a year means transaction fees will not significantly impact the overall returns from the strategy.
How the strategy performed
So what were the results of this strategy?
The authors found that the average monthly return for stocks selected using this strategy was 2.55%. This is three times the 0.85% monthly return for the NYSE-AMEX Small Cap Index.
On a yearly basis, the net net portfolio posted an impressive 22.4% outperformance over the NYSE-AMEX index.
Here are the monthly returns for the portfolio of net net stocks (NVAC portfolio) and the NYSE-AMEX index. The monthly returns are grouped by time period to illustrate how this strategy did over different points in time.
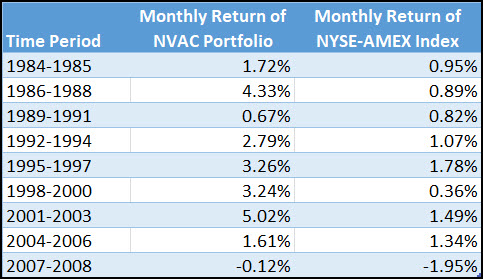
Source: Ben Graham's Net-nets: Seventy-Five Years Old and Outperforming
We see that over a total of nine time periods, there is only one time period from 1989-1991 that the net net companies posted lower average monthly return than the market.
This is very impressive!
Reasons why this strategy posted such high returns
What explains the higher returns of stocks which are selling below their NVAC? The researchers found three reasons the strategy outperformed the market.
1. Riskiness of stocks
The relative volatility (Beta) of this basket of net-net stocks compared to the NYSE-AMEX is 1.08. A higher beta means that the stocks will exaggerate the movement of the markets.
So if the markets rise by 10%, then this basket of stocks will go up by 10.8%. Similarly, if the market falls by 10%, this portfolio of stocks will fall by 10.8%. Some research papers have found that a high beta is associated with higher levels of returns.
While this beta of 1.08 is higher than the market (NYSE-AMEX), it is not high enough to significantly explain why the net-net strategy performs really well.
2. Small Market Cap
The stocks in this net-net strategy tend to be small firms. It is well documented in financial research that smaller stocks have tended to outperform large stocks historically.
This may be to compensate for the added risk of holding small companies, since they will not be able to whether financial downturns as well as big corporations with loads of cash reserves.
3. Liquidity
The net-net stocks the authors selected were illiquid. Companies that are illiquid and difficult to trade compensate investors by providing them with higher than average returns.
High returns remained unexplained
An interesting thing is that even accounting for these 3 factors, there is still an unexplained excess return the net-net strategy generated. Even though they could not find an explanation for the excess returns, you and I can still take advantage of this spectacular strategy.
Net-Net Research paper #2
Another paper by the same authors confirms high returns of net net strategy
The same authors came out with another research paper called “Dissecting the Returns on Deep Value Investing” that further tests Ben Graham’s net-net strategy and tries to explain why the strategy performs so well.
This time, the researchers back tested the net-net strategy over the 35 year period from 1975 - 2010, and again found that the strategy significantly outperformed the market.
How they defined a net-net stock
This time, the researchers calculated net current asset value according to the original formula put forth by Graham himself:
NCAV = [Cash + 0.75*Net Receivables + 0.5*Inventory – (Total Liabilities + Preferred Stock)]/ Shares Outstanding
Filtering the Stock Universe
The universe begins with all stocks trading on the NYSE, AMEX, or NASDAQ. The universe is filtered to select only stocks that are selling below their NCAV.
Keeping the strategy practical for me and you
To keep the strategy practical for investors like us, they removed the most illiquid stocks.
They construct two test portfolios based on two different price filters:
- One portfolio has a filter of shares that are trading for $5/share or higher. The average firm that is selling for under its NCAV and over $5 per share has a market cap of just over $40 million.
- The other portfolio has a price filter of $3 per share or higher applied to it. The mean market capitalization of firms in this portfolio is just over $30 million.
This, again, is good for us. We are able to invest in companies that are small and under the radar. In fact, 2/3 of the net net stocks had zero analysts following the company.
Holding Period
The entire portfolio of net-net stocks was created on March 1st, held for a year and sold the last day of February the following year.
What the researchers found?
The average monthly return for the portfolio with net-net stocks selling for above $5/share was 6.01%. This is over seven times the return of the S&P 500 which returned only 0.78% monthly over the same time period.
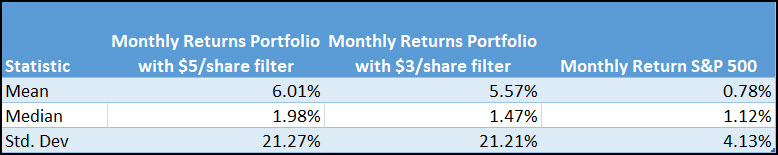
Click image to enlarge
Source: Dissecting the Returns on Deep Value Investing
Why does the net-net strategy do so well - possible explanations?
1. Riskiness of stocks
As in their first paper, the authors found that market risk (as measured by beta) partly explains why net-net stocks produce higher returns than the market. Since these stocks are more risky than the average stock, it must compensate by providing higher returns than the average stock.
2. Market Liquidity
The firms that are selling below their NVAC are most often small and hard to easily buy and sell. Investors think these stocks are riskier, as if some negative news comes out of the company, it will take the investor longer to sell his shares. For this reason, illiquid stocks like the ones in this net net strategy offer a higher return to compensate investors for the higher risk.
3. Long-term Reversal
There is some interesting research that we may talk about in another article. What this research says is that stocks that have been performing poorly in the past 3-5 years will do well in the future. Similarly, stocks that have been doing well in the past 3-5 years will perform poorly in the future.
In order to become as cheap as they are now, net-net stocks must have been performing poorly in the past 3-5 years. The authors of this research paper found that this ‘long-term reversal’ factor may have contributed to the good returns of the net-net strategy.
4. Financial Distress
Financial Distress is a measure of how difficult it will be for a company to repay all their liabilities. The researchers found that companies with declining earnings were thought to be more distressed than peer firms. The market overreacted to recent poor performance and under-price these stocks.
What makes one net-net stock better than another?
1. Low Analyst Coverage
The paper found a positive association between less analyst coverage and higher returns. Without the analyst report, it may be that investors have a harder time finding these net-net companies. You and I have no trouble finding these companies with a stock screener.
2. Low trading volume
Stocks with low trading volume generate higher returns than stocks with a higher trading volume. This is partly because of the higher returns due to low liquidity discussed earlier. It is also because institutional investors have a much harder time making a big investment in the company.
Net-Net Research paper #3
Does the net net strategy also work outside the U.S.A?
We have seen research that shows the outperformance of this strategy in the United States, but can international investors also take advantage of the strategy?
Two researchers in the United Kingdom set out to find out if the net-net strategy also works outside the United States in a research paper called “Testing Benjamin Graham’s Net Current Asset Value Strategy in London”
What was the back test period and investment universe?
The researchers populate their investment universe with all stocks that have traded on the London Stock Exchange over the 24 years from 1981 - 2005.
They then filter out companies with more than one type of ordinary share class. So if a firm had class A and class B shares, it would not be included in the study.
Further, firms incorporated in countries outside of the UK were excluded from the study. Financial sector companies were also eliminated from the stock universe. The reason why is not explicitly given by the authors but most likely because the net-net calculation cannot be applied to banks.
Making the results more accurate - avoiding biases
Survivorship bias was eliminated by including companies that have been delisted from the exchange.
What the authors classified as a net-net stock
The authors take the NCAV of a firm and divide it by the total market value (MV) of the stock. Companies with a NCAV/MV ratio higher than 1.5 were counted as a net net stock.
This means if the company were to go bankrupt and liquidate all its current assets, they would sell for more than 50% of the company’s current market value.
How often did the researchers rebalance the portfolio?
The portfolio was formed annually in July, and used accounting data made public in December to calculate NCAV. So no look ahead bias here!
On average, there were 1109 firms to select from when the portfolios were formed in July.
Ok, so how did the strategy perform in a market outside of the United States?
Performance of net-net stocks in the UK
The average raw annualized return of an equal weighted portfolio of net net stocks was 31.19%. This is compared to only 20.51% average raw returns for the market index.

Source: Testing Benjamin Graham’s Net Current Asset Value Strategy in London
Notice that this BIG difference of 10.68% a year. It adds up to a huge difference in return, even after just 5 years. Cumulative returns after 5 years are almost double for the net-net strategy than just investing in the market.
High Returns puzzle researchers again
The authors try to explain the high returns for the net-net strategy using similar factors to the papers we discussed earlier. Like the other researchers, they could not fully explain the high returns of the net net strategy.
Net-Net Research paper #4
Variations to the net-net strategy
Researchers from the U.S. and South Korea attempt to see if they can modify the net-net strategy and extract higher returns in this research paper Testing Benjamin Graham’s net current asset value model.
Their back test period was the 13 years from 1999-2012. This is a shorter back test time that other papers, but it can still help us gain some insights in how to best modify the net net strategy.
Here is what they did to determine the best variations of the net-net strategy.
They test if:
- Cheaper stocks (Higher NCAV/Market Value of company) leads to higher returns
- Different holding periods lead to different returns
- Only holding net-net stocks during growth periods leads to higher returns
It is logical to think that the higher a firm's’ NVAC is relative to its market value, the higher its returns will be. To test this hypothesis out, the authors break up net-net stocks into 3 different categories:
- Portfolio 1 = NCAV/MV > market price×1
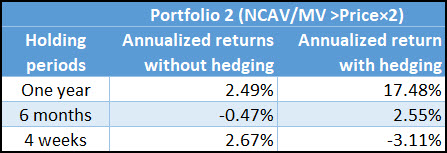
- Portfolio 2 = NCAV/MV > market price×2
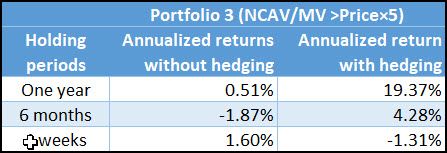
- Portfolio 3 = NCAV/MV > market price×5
So, for example, the number 3 portfolio only includes companies where if all the assets of the company were to be sold, the money received would be more than 5x the market cap of the company.
How did these three different portfolios perform?
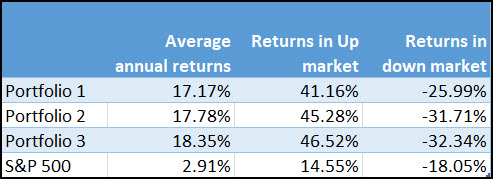
Source: Testing Benjamin Graham’s net current asset value model
Like expected, investing in net net stocks with higher NCAV/MV generated higher returns. However, these stocks also performed worse in down markets. The authors found that holding periods of 4 weeks and 1 year had the highest returns.
They added a market timing factor
However, there is one big change that the authors tested.
The authors used an indicator to purchase net-net stocks only when market conditions were favourable. I recommend reading the actual paper to get a full explanation as this is a simple explanation.
Basically, markets are said to be undervalued when the forward earnings yield (inverse of the Price to Earnings ratio) of the S&P 500 is higher than the long term treasury yield. Why this is the case is beyond the scope of this article, but I encourage you to read the paper and do your own research if you are interested.
The strategy of buying net net stocks only when the forward earnings yield of the S&P 500 is higher than the long term treasury yield is called “hedging” by the authors. The returns produced when using this hedging strategy were very different than before.
The authors found that 1 year was the best holding period when only investing during favourable market conditions. In fact, as the holding period got shorter, the returns got worse.
A portfolio of stocks with NVAC at least 1x greater than current market value of the firm produced 16.84% returns annually if the hedging strategy described above was used. If the stocks were only held for 4 weeks, the net-net strategy returned -3.28%.
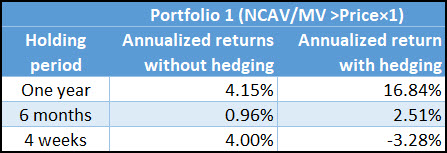
Source: Testing Benjamin Graham’s net current asset value model
A portfolio of stocks with NVAC at least 2x greater than current market value of the firm produced 17.48% returns annually if the hedging strategy described above was used. If the stocks were only held for 4 weeks, the net-net strategy returned -3.11%.
Source: Testing Benjamin Graham’s net current asset value model
A portfolio of stocks with NVAC at least 5x greater than current market value of the firm produced 19.37% returns annually if the hedging strategy described above was used. If the stocks were only held for 4 weeks, the net-net strategy returned -1.31%.
Source: Testing Benjamin Graham’s net current asset value model
Key Things to remember about a net-net strategy
- Returns are safe from big institutional investors
- Strategy has shown to produce 20 - 30% annual returns
- You must create a margin of safety by investing in only stocks with NVAC 1.5x above market cap of the firm
- Re-balance yearly or less to keep transaction costs including bid ask spreads low
- The strategy invest in under the radar net-net firms without any analyst coverage
- If possible, invest in net-net stocks when forward earnings yield of S&P 500 is higher than long term bond yield
- Net-net strategy also works outside of the United States
- You must buy a basket of at least 30 or more stocks to spread your risk.
Screen for net-net stocks worldwide in minutes
The Quant Investing screener covers 22,000+ companies across global markets and includes the Net Current Asset Value (NCAV) ratio as a primary filter. Set NCAV above 1.5, add Piotroski F-Score as a quality filter, and your net-net screen is ready — no spreadsheet required.
Try the net-net screener free for 30 days
No credit card needed. Cancels automatically after 30 days.
You must buy a basket!
As you can imagine there is a good reason why companies get this undervalued. If you look at the list of net-net ideas a screen comes up with you will see that these are companies that have problems – most likely BIG problems.
This is why Benjamin Graham suggested that you lower your risk by investing in a number of net-net investments, he suggested that you invest in basket of at least 30 such ideas to lower the risk of any one company (or a few) going bankrupt.
The idea is that other companies in the basket will do so well, more than compensating for the few companies that may go bankrupt.
How to find your own Net-Net Stocks
The Quant investing stock screener defines Net Current Asset Value (NCAV) as follows:
Net Current Assets Value (NCAV) = (Current assets (cash, inventories and accounts receivable) – All possible Liabilities) / Market value
With all possible liabilities calculated as (Total Assets - Common Shareholders Equity)
Margin of safety
As you can see in the above calculation nothing is done to lower the value of inventory or accounts receivable as Benjamin Graham suggested.
NCAV > 1.5
To make up for this you can make sure that the companies the stock screen have a net current asset value ratio of more than 1.5.
This means that all the companies have net assets (after all liabilities have been deducted) worth at least 1.5 the current market value of the company.
Step by step Net Net investing instructions
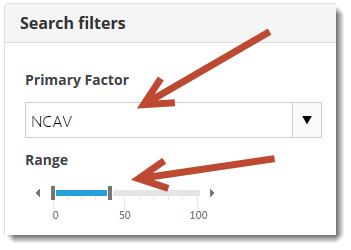
Step 1 – Use NCAV in the Primary slider
Select the cheapest companies in terms of NCAV
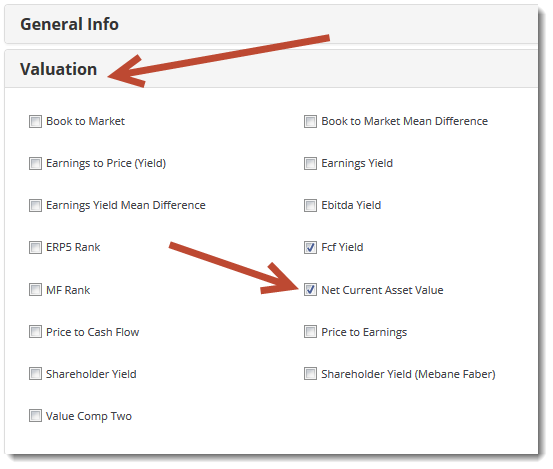
Step 2 – Add Net Current Asset Value as an output column
Click the Choose Columns button, click on the valuation tab and tick the box next to Net Current Asset Value.
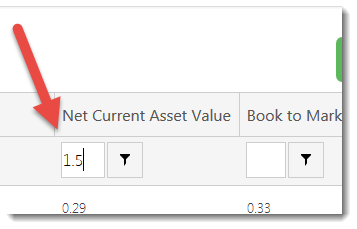
Step 3 – Filter for companies with a Net Current Asset Value of greater than 1.5
To do this type 1.5 into the box below the Net Current Asset Value column.
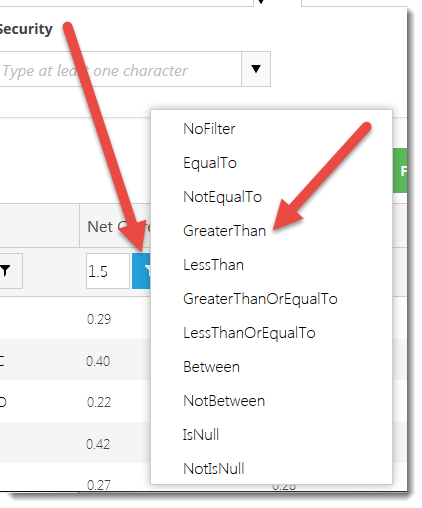
Next click on the small funnel icon and select GreaterThan
First 10 net-net investment ideas
Below is a list of 10 net-net ideas sorted (click on the column heading to sort) by net current asset value (NCAV):
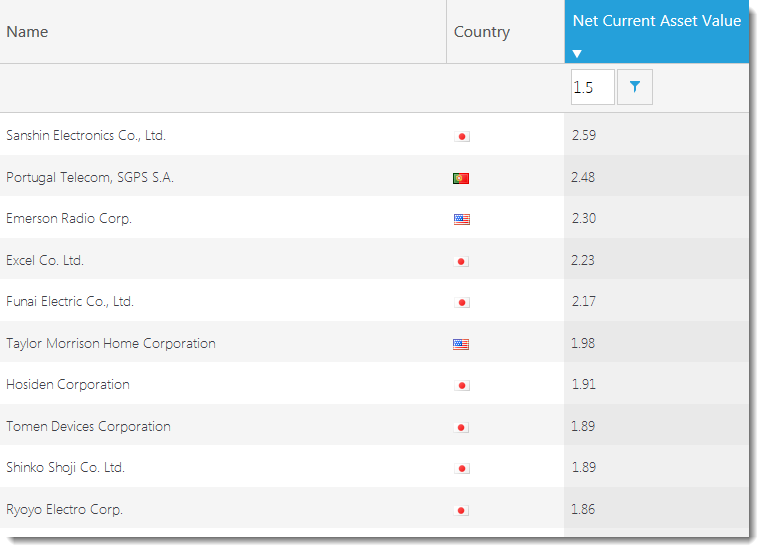
Click image to enlarge
How to select quality Net Nets
As I mentioned a net-net company is usually a low quality business. You can however improve the quality of your net nets by using the Piotroski F-Score. You can find more information on the Piotroski F-Score here: This academic can help you make better investment decisions – Piotroski F-Score
If you use the above list but remove all companies with a Piotroski F-Score of less than 5 (Piotroski F-Score values go from 0 to 9) the list of investment ideas look like this:
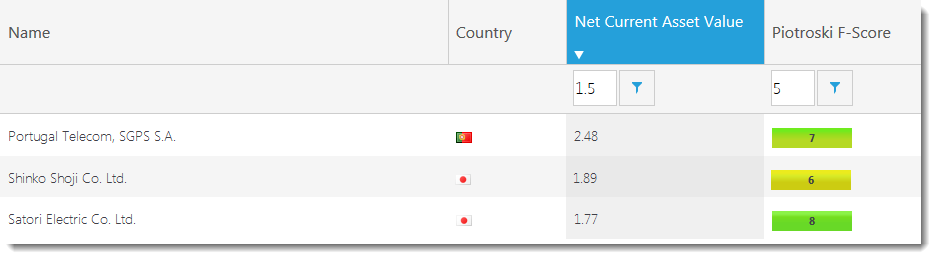
Click image to enlarge
Net-net with positive free cash flow
If you want to screen out companies that are burning cash (this decreased NCAV over time) you can do this by selecting net nets with a cash flow to capital expenditure ratio greater than 1. (Cash flow to Capex = Cash from Operations / Capex)
This will make sure the company has been able to meet all its capital expenditure with cash flow generated by the business, or you can say the company has positive free cash flow.
Your research is required
Please remember, as with all screens, the names the screener comes up with should just be the start of your research process. And because net-nets are high risk investments detailed research of the company’s financial statements is very important.
Frequently Asked Questions
1. What is the Net-Net investment strategy?
The Net Net strategy, created by Benjamin Graham, focuses on finding companies that trade for less than their liquidation value. This means you could buy the company, sell all its assets, pay off its debts, and still make a profit.
2. How do I calculate Net-Net working capital?
Net-Net working capital is calculated as: Cash and short-term investments + (75% of accounts receivable) + (50% of inventory) - All liabilities. This conservative formula ensures you're buying undervalued companies.
3. Does the Net-Net strategy really work?
Yes. Four independent studies confirm net-net portfolios have generated 20–30% annual returns. Oppenheimer's 24-year US study found 22.4% annual outperformance. A UK study across the London Stock Exchange found 31.19% annual returns vs 20.51% for the market. The strategy has outperformed across US and international markets.
4. Why don’t big investors use the Net-Net strategy?
Large funds usually ignore Net-Net stocks because they are too small and few in number to impact their overall returns. This leaves more opportunities for individual investors like you and me to profit from these undervalued stocks.
5. What are the risks of the Net-Net strategy?
Net-Net stocks are often companies in trouble, which is why they are so cheap. To reduce risk, it's best to invest in a basket of at least 30 Net-Net stocks. This way, if a few go bankrupt, the gains from the others can still give you a good overall return.
6. How do I find Net-Net stocks?
You can use the Quant Investing stock screener to find Net-Net stocks. Use the already saved screen or set the screener to find companies with a Net Current Asset Value (NCAV) of more than 1.5 times their market value. This will help you find the best investment ideas.
7. How can I improve my Net-Net investments?
To improve your Net-Net investments, look for companies with a Piotroski F-Score of 5 or higher. This score helps you find higher quality Net-Net stocks. You can also check for positive free cash flow to ensure the company is generating enough cash to cover its expenses.
Find your first net-net investment ideas today
The step-by-step instructions above show exactly how to set up the screen. The free demo gives you full screener access — including NCAV filtering, Piotroski F-Score, free cash flow, and all 110+ ratios — across 22,000+ global companies.
Start your free 30-day net-net screen now
No credit card needed. Cancels automatically after 30 days.
