

Want to invest in stronger companies and avoid financial disasters? The Piotroski F-Score is a research-backed tool that helps you separate fundamentally strong stocks from weak ones. It is simple, powerful, and has been proven to improve returns.
By the end, you'll have a practical way to increase your returns and reduce risk by avoiding bad quality companies. This is a must-read if you are serious about making better investment decisions and want higher returns.
Estimated Reading Time: 5 minutes
Further Reading About The Piotroski F-Score articles
Here are other interesting article about the Piotroski F-Score:
Can the Piotroski F-Score also improve your investment strategy?
Can you use the Piotroski F-Score to improve Growth Investment Returns?
Use the Piotroski F-Score to seriously improve your returns
Ever thought of using a fundamental stop-loss?
In a groundbreaking 2000 research paper, Joseph Piotroski, a University of Chicago professor, demonstrated how a simple 9-point ranking system could significantly improve investment returns. Despite its effectiveness, many investors still overlook this powerful tool.
Before I tell you more about the ranking system, first something on the person behind the study.
Meet the Professor Behind the F-Score
The developer of the system is Joseph D. Piotroski an accounting professor who shuns publicity and rarely gives interviews.
He graduated from the University of Illinois with a B.S. in accounting in 1989, received an M.B.A. from Indiana University in 1994. Five years later, in 1999, after earning a Ph.D. in accounting from the University of Michigan, he became an associate professor of accounting at the University of Chicago.
The F-Score Research Paper
In 2000, he wrote a research paper called "Value Investing: The Use of Historical Financial Statement Information to Separate Winners from Losers".
He wanted to develop a ranking system (using a simple nine-point scoring system) to increase the returns of a low price to book investment strategy (referred to in the paper as high book to market investment strategy).
What He Found
His findings were astonishing. Stocks with the highest F-Scores (8 or 9) outperformed the market by 13.4% per year for 20 years. Even more impressive, a strategy that combined buying high F-Score stocks and shorting low F-Score stocks (0 or 1) delivered 23.0% annual returns—far exceeding the S&P 500’s 15.83% average return.
This average outperformance may not seem like much but over the 20 year period an investment of 100 in this long short strategy would have grown to 6,282 compared to an amount of only 1,860 if you invested in the S&P 500 index.
The difference between these two rates of return over the 20 year period is over 44 times your initial investment!
Click here to start using the Piotroski F-Score in your portfolio Now!
Does it Also Work in Europe?
After getting really excited about the returns I asked myself if this would also work in Europe and in the current market environment.
But more on that later, lets first look at how the Piotroski F-Score is calculated.
How is the Piotroski F-Score Calculated?
The Piotroski F-Score is a 9-point checklist that assesses a company's financial strength. It is broken down into three categories: Profitability, Financial Health, and Efficiency.
Profitability
1. Return on assets (ROA)
Net income before extraordinary items for the year divided by total assets at the beginning of the year.
Score 1 if positive, 0 if negative
2. Cash flow return on assets (CFROA)
Net cash flow from operating activities (operating cash flow) divided by total assets at the beginning of the year.
Score 1 if positive, 0 if negative
3. Change in return on assets
Compare this year’s return on assets (1) to last year’s return on assets.
Score 1 if it’s higher, 0 if it’s lower
4. Quality of earnings (accrual)
Compare Cash flow return on assets (2) to return on assets (1)
Score 1 if CFROA>ROA, 0 if CFROA<ROA
Funding
5. Change in gearing or leverage
Compare this year’s gearing (long-term debt divided by average total assets) to last year’s gearing.
Score 1 if gearing is lower, 0 if it’s higher.
6. Change in working capital (liquidity)
Compare this year’s current ratio (current assets divided by current liabilities) to last year’s current ratio.
Score 1 if this year’s current ratio is higher, 0 if it’s lower
7. Change in shares in issue
Compare the number of shares in issue this year, to the number in issue last year.
Score 1 if there is the same number of shares in issue this year, or fewer. Score 0 if there are more shares in issue.
Efficiency
8. Change in gross margin
Compare this year’s gross margin (gross profit divided by sales) to last year’s.
Score 1 if this year’s gross margin is higher, 0 if it’s lower
9. Change in asset turnover
Compare this year’s asset turnover (total sales divided by total assets at the beginning of the year) to last year’s asset turnover ratio.
Score 1 if this year’s asset turnover ratio is higher, 0 if it’s lower
Piotroski or F-Score = 1 + 2 + 3 + 4 + 5 + 6 + 7 + 8 + 9
Good or high score = 8 or 9
Bad or low score = 0 or 1
How You Can Best Use the Piotroski F-Score
The F-Score acts like a financial quality filter—helping you avoid weak companies and focus on those getting stronger.
The F-Score Shows Fundamental Momentum
Or said in a different way it is a measurement of the fundamental momentum of a company - is it getting better or worse?
It does not tell you anything about the valuation - expensive or cheap - of the company.
The F-Score is thus best used along with another valuation measure such as price to book ratio (as a first screening measure) where after you use the Piotroski F-Score to select only quality companies.
Click here to start using the Piotroski F-Score in your portfolio Now!
Does the F-Score Also Work in Europe?
Back to the question if the Piotroski F-Score works in Europe and in the current market environment?
The answer is a clear yes!
And was convincingly answered in the research paper I wrote with my friend Philip Vanstraceele called Quantitative Value Investing in Europe: What works for achieving alpha
The following example shows how the Piotroski F-Score increased the returns of a simple Price to Book strategy.
If you only used Price to Book
The table below shows the returns you could have earned if you only used a low Price to Book value strategy to invest in Europe over the 12 year period 13 June 1999 to 13 June 2011.
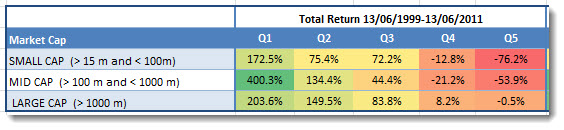
Source: Quantitative Value Investing in Europe: What works for achieving alpha
Q1 (Quintile 1) represents the cheapest 20% of companies in terms of Price to Book ratio and Q5 (quintile 5) the most expensive.
The strategy worked well as the lowest Price to Book companies (Q1) substantially outperformed the market, which over the same 12 year period returned 30.54%.
Price to Book with Piotroski F-Score
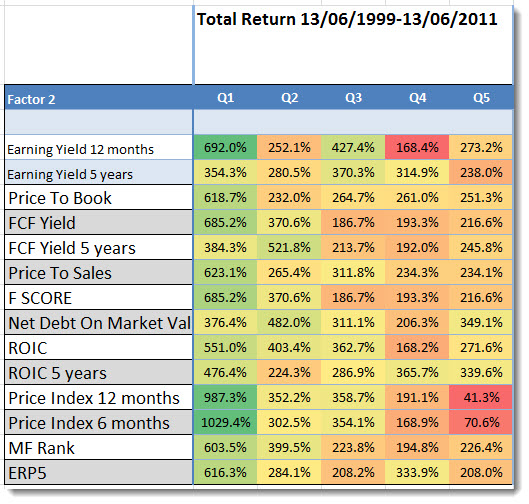
If you combined the low Price to Book strategy with the 20% of companies with the best (highest) Piotroski F-Score the following tables shows what your return would have been over the same 12 year period.
Click image to enlarge
Source: Quantitative Value Investing in Europe: What works for achieving alpha
To get the above results we first selected the 20% of companies with the lowest Price to Book ratio. We then sorted these companies into five quintiles (20%), quintile one (Q1) was the most undervalued and quintile 5 Q5 the most overvalued in terms of each of the ratios of indicators in the column called Factor 2.
An 284.9% Improvement!
You can see that if you selected only the best Piotroski F-Score companies the return of your low Price to Book ratio investment strategy increased from 400.4% to 685.2% (Row: F Score Column: Q1), an improvement of 284.9% over the 12 year period.
The Piotroski F-Score Improved ALL Investment Strategies
In the research paper selecting the best Piotroski F-Score companies not only improved the returns of a low Price to Book strategy it also improved the returns of other strategies.
For example:
- Returns from a high Earnings Yield strategy was increased from 236.3% to 447.1% (+210.8%)
- Returns from a high Free Cash Flow Yield strategy was increased from 317.4% to 568.7% (+251.3%)
- Returns from using Joel Greenblatt’s Magic Formula was increased from 182.8% to 349.0% (+166.2%)
Click here to start using the Piotroski F-Score in your portfolio Now!
How You Can Use the Piotroski F-Score
This is how you can screen for low price to book ratio (high book to market ratio which is the inverse of price to book) screen with a high (good) Piotroski F-Score.

Source: Quant Investing stock screener
You can of course use any other valuation ratio and even add two other criteria with the two further sliders the screener offers you.
The F-Score is Not Wildly Popular
Most investors overlook the F-Score. Do not make the same mistake. If you want to increase your returns and lower your risk, start using the F-Score today.
As the evidence show, it will substantially increase your investment returns, irrespective of what investment strategy you follow.
P.S. Here is another interesting article on the Piotroski F-Score: Can the Piotroski F-Score also improve your investment strategy?
PPS To get the Piotroski F-Score working in your portfolio sign up here
Click here to start using the Piotroski F-Score in your portfolio Now!
More Information About The Piotroski F-Score
Here are other interesting article about the Piotroski F-Score:
Can the Piotroski F-Score also improve your investment strategy?
Can you use the Piotroski F-Score to improve Growth Investment Returns?
Use the Piotroski F-Score to seriously improve your returns
Ever thought of using a fundamental stop-loss?
Frequently Asked Questions
1. What is the Piotroski F-Score?
The Piotroski F-Score is a 9-point system that evaluates a company’s financial strength by analysing profitability, funding, and efficiency metrics.
2. How can the Piotroski F-Score improve my investments?
Using the F-Score, you can identify financially strong companies, that our tests have shown can substantially increase your returns, especially when combined with the best valuation ratios like EV to EBIT and Free Cash Flow Yield.
3. Is the F-Score complicated to calculate?
No, it's straightforward. The score is based on nine financial indicators, each either scoring 1 or 0, depending on performance.
4. Does the F-Score work in all markets?
Yes, the F-Score has shown effectiveness in various markets, including Europe, by improving returns across different investment strategies.
5. Should I use the F-Score alone?
It’s best to use the F-Score with other valuation ratios, like the EBIT to EV, to select undervalued quality stocks.
6. What’s the benefit of a high Piotroski F-Score?
A high F-Score (8 or 9) indicates a company with strong fundamentals, which historically has led to better performance.
7. Can the F-Score help with shorting stocks?
Yes, shorting companies with low F-Scores (0 or 1) while buying those with high scores has historically led to significant outperformance. It worked best with small companies which may be problematic to short so do your research first.
8. Does the Piotroski F-Score help in today’s market?
Research shows that the F-Score continues to be effective in the current market environment, increasing returns across various strategies.
9. Why isn’t the F-Score more popular?
Despite its proven success, many investors overlook the F-Score, possibly due to its simplicity or lack of mainstream knowledge. It is an easy to add factor to make sure you are selecting higher quality companies.
10. How can I start using the Piotroski F-Score?
You can begin by incorporating the F-Score into your stock screens and investment strategy, to make sure you focus on stocks with high scores. Research has shown this will improve your portfolio returns.
Click here to start finding High F-Score companies for your portfolio NOW!
