

Your Smart Path to Wealth: The Best Large Cap Strategy We’ve Ever Tested
By Tim du Toit, Head Analyst. 39 years investing experience (since 1987). Author of Quantitative Value Investing in Europe: What Works for Achieving Alpha. Based in Hamburg, Germany. Last updated: May 2026.
Shareholder Yield Letter — definition:
A monthly investment newsletter recommending three to five large companies that return cash to shareholders through dividends and share buybacks. Based on James O'Shaughnessy's Shareholder Yield strategy, tested over 80 years of US market data (1927–2009), which beat the market on 97% of rolling 10-year periods. Applied to the Market Leaders universe. 20% trailing stop-loss on every position. New buying stops when the MSCI World index falls below its 200-day moving average. Published since 16 May 2023.
Dear Fellow Investor
We have always aimed to empower investors like you with the best investment strategies and tools. While the Quant Value newsletter has delivered great results, many subscribers found it hard to buy the small companies it recommends.
This inspired us to create an easy-to-follow strategy for large caps that works just as well, if not better.
Looking for a Great Large Cap Strategy
We needed a large company investment strategy that was easy to implement, practical for all brokers, and rooted in the same commitment to research and real-world testing that defines what we do here at Quant Investing.
With that in mind, we started searching for a solution that could deliver the same market-beating success.
Why Shareholder Yield
Shareholder Yield ranks companies on total cash returned to shareholders, dividends plus net share buybacks minus net new debt. It is the closest thing to an objective measure of how well a company is rewarding its owners. We tested it against the standard alternatives. The numbers below are why I chose it as the basis of the newsletter.
We Kept On Seeing Great Returns
The more we searched the more we saw research by well-known investors saying that even they were surprised about the strategy's returns.
The strategy was so good that James O’Shaughnessy did an 80-year back-test from 1927 to 2009 and found that it outperformed the market on 97% of rolling 10-year periods, by an average of 3.41% per year. Over 3-year rolling periods it outperformed on 81% of periods by 3.24% per year on average. Less than half than half of all fund managers beat the market over any 10-year stretch. This is the base rate the newsletter is built on.
Here is a summary of the 80-year back test:
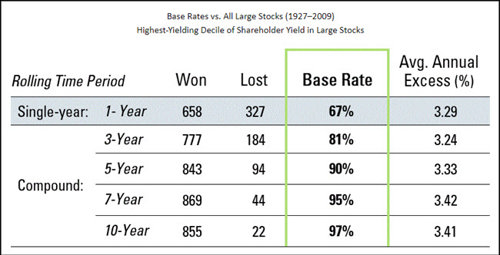
Source: 7 Traits for Investing Greatness by Jim O'Shaughnessy (80-year (1927–2009) back test of the shareholder yield investment strategy)
| Rolling period | % of periods strategy beat the market | Average outperformance per year |
|---|---|---|
| 3-year rolling | 81% | +3.24% per year |
| 10-year rolling | 97% | +3.41% per year |
Source: James O'Shaughnessy, 7 Traits for Investing Greatness. Universe: top 10% of large US stocks ranked by Shareholder Yield. Period: 1927–2009.#
The Idea Started Forming
As our mission is to help you invest smarter we took this strategy one step further. We paired the proven power of Shareholder Yield with an elite group of companies, the Market Leaders. These are large-cap companies with good fundamentals, giving you the best of both worlds: consistent returns and ease of execution.
Market Leaders may sound familiar, it is an investment universe that James O'Shaughnessy developed and tested in his terrific book What Works on Wall Street.
The Market Leaders Universe
Market Leaders are not just large companies; they’re exceptional companies. By focusing on businesses with strong fundamentals - high market value, strong cash flow, and above-average sales - we are giving you a strategy designed to outperform in any market.
Live backtest, December 2015 to May 2022
At Quant Investing, we don’t rely on theories. Every strategy we recommend is well tested to ensure it works in the real-world. When we tested Shareholder Yield with the Market Leaders universe, the results amazed us - that is why we are so confident it will work for you.
Here is a brief summary:
| Metric | Shareholder Yield + Market Leaders | Index benchmark |
|---|---|---|
| Annualised return (Dec 2015 – May 2022) | +15.5% | +9.3% |
| Total return over 6 years | +169.1% | +80.8% |
| Negative years | 1 | 2 |
| Average dividend yield (back-test universe) | 6% | — |
| Average market cap | €45.8B / $50B | — |
| Average daily traded value | €200M / $210M | — |
Back-test source: Shareholder Yield + Market Leaders strategy. Period: Dec 2015 to May 2022.
See the current Shareholder Yield Letter
If a strategy with a 97% rolling 10-year win rate over 80 years of US data fits how you want to invest for income, the Shareholder Yield Letter brings you three to five new ideas every month. Executive summary, valuation table, and full company write-up for each.
See the Shareholder Yield Letter
30-day money-back guarantee. No questions asked.
Comments On the Chart
#1 Only 1 negative year - As you can see there was only one negative year and it was 6 percentage points less than the index, which had two negative years.
#2 Dividend yield of 5-6% - The backtest universe averaged 6%. Live newsletter dividends averaged just under 5% across the first three years. Either way, this is meaningful cash income for a retirement or tax-sheltered account.
#3 Average market value €45.8 billion or $50 billion - The average company size is massive, over €45 billion ($50 billion). This makes the companies extremely easy to buy also with your current broker and even in your tax-free account.
#4 Average traded value €200 million or $210 million - The daily traded value is also huge, just under $200m per day. This means easy, fast and cheap order execution with a low bid-offer spread. No more limit adjustments as the price runs away or expensive orders executed over days.
Three Years of Results — the Honest Scorecard
The first issue went out on 16 May 2023. As of May 2026 the newsletter has produced 128 recommendations across three full years. Here is what that data shows.
The headline numbers
- 87 of 128 ideas (68%) finished with a positive total return.
- Average return per idea: +22.7%. Winners averaged +39%. Losers averaged −12%. A 3.25 to 1 win-to-loss size ratio.
- 91% of positions paid a dividend, averaging 6.2% of purchase price in cash over an average 1-year hold. That annualises to about 7.2% per year before any price gain.
- 22 ideas returned more than 50%. 5 ideas more than doubled. Biggest winner: Barclays at +150.5%.
- Biggest loser: B&M European Value Retail at −40.3%. Worst sector: autos (11 ideas, 27% positive, −3% average).
Year by year vs MSCI World (EUR)
The first 18 months were painful. US technology stocks carried the index, and a dividend-and-buyback portfolio of mature businesses cannot own that kind of growth-momentum trade. Market leadership has broadened since. This is what €1,000 invested at launch looks like.
| Year | SHY Letter | MSCI World (EUR) | Difference |
|---|---|---|---|
| 2023 (from 16 May) | +4.5% | +13.1% | −8.6% |
| 2024 | +8.8% | +25.0% | −16.3% |
| 2025 | +16.5% | +5.4% | +11.1% |
| 2026 YTD | +7.1% | +1.8% | +5.3% |
€1,000 in the newsletter is now €1,419. €1,000 in MSCI World is now €1,517. The newsletter is 9.9 percentage points behind cumulatively, with the gap closing rapidly: it was 25 points 18 months ago.
This is how a value-style strategy is supposed to work over a full cycle. It does not lead during narrow tech rallies. It leads when market breadth returns. I would rather show you both halves of that cycle than only the second one.
The Biggest Dividend Payers
| Company | Cash returned (% of purchase price) | Holding period (years) |
|---|---|---|
| British American Tobacco | 34.5% | 2.9 |
| Telenor | 29.1% | 2.7 |
| Altria | 25.5% | 2.5 |
| Imperial Brands | 24.1% | 2.8 |
| CaixaBank | 17.7% | 2.0 |
Time Has Shown its Hand
The most striking finding from the three-year data: every single position held longer than 18 months is positive. All 23 of them. Positions held less than 6 months averaged −5.5% with only 32% positive. The strategy compounds over multi-year periods, and that is the holding period to plan for.
For the full year-by-year, sector-by-sector and holding-period breakdown, see the Shareholder Yield Letter Track Record.
Shareholder Yield vs an Index Fund
Index funds treat every company in the index the same, including the ones returning no cash to shareholders. Shareholder Yield filters for the companies that actively reward owners through dividends and buybacks, in the Market Leaders subset of the index.
Over the three years since launch, the newsletter is 9.9% behind the MSCI World cumulatively. Over the prior 80 years of back-tested US data, the strategy beat the market on 97% of rolling 10-year periods. Both are true. Both are necessary context. If you are willing to underperform during narrow tech rallies in exchange for a high probability of outperformance over a full cycle, this is the trade you are making.
If you are not willing to make that trade, an index fund is the right answer for you.
What You Get Each Month
This newsletter is built with you in mind. That is why we’ve designed it to give you the 90/10 advantage, using just 10% of your time to achieve 90% of the returns you need to grow your wealth.
Each month we give you only the information you need to quickly build up a diversified, high performance, large cap, investment portfolio.
We Do Not Waste Your Time
The newsletter does not waste your time telling you what the market has done, or what it is going to do - no one knows that. It simply gives you the information you need – what to buy and sell.
All you must do is log into your brokerage account and follow the easy-to-follow instructions - they are all on the first page. This means managing your own successful portfolio will not take more than half an hour per month.
This is what the clear instructions on the first page looks like:
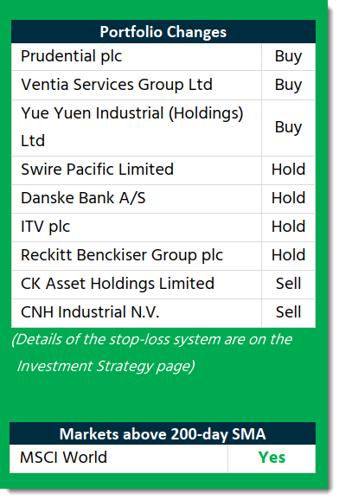
Front page recommendations – example
Every issue opens with the same one-page action summary:
- The new buy recommendations for the month with target weights
- Sell instructions with the trigger reason (stop hit, thesis break, regime change)
- The current holdings list, each labelled Buy, Hold, or Sell
- The market regime check (MSCI World vs 200-day SMA)
- The summary cash dividend total received in the prior month
The rest of the issue contains the detailed write-ups for each new idea: executive summary, valuation table, risk notes, and full reasoning. The first page is what you need to place the trades. The rest is for when you want the homework behind them.
Subscribe to the Shareholder Yield Letter
30-day money-back guarantee. No questions asked.
How the Two Risk Rules Have Performed
The newsletter uses two protective rules from day one:
- A strict 20% trailing stop-loss on every position
- New buying stops when the MSCI World Index falls below its 200-day moving average.
Three years of live data on how those rules performed:
- 7 of 128 positions (5.5%) hit the 20% stop-loss
- Only 1 position (B&M European Value Retail) fell more than 40% before being sold
- The average losing position lost 12%, against an average winning position of +39%
The rules do not eliminate losses. They keep the losses small enough that the 3.25 to 1 win-to-loss size ratio does the compounding work.
Return of All Ideas
Distribution of returns across all 128 ideas (May 2023 to June 2026 — UPDATE WITH JULY DATA)
| Return bucket | Number of ideas | % of total |
|---|---|---|
| More than +50% | 22 | 17% |
| +10% to +50% | 41 | 32% |
| 0% to +10% | 24 | 19% |
| −10% to 0% | 24 | 19% |
| More than −10% | 17 | 13% |
63 ideas (49%) returned more than 10%. 17 ideas (13%) lost more than 10%. That is a 3.7 to 1 ratio of large wins to large losses.
Through 30 June 2025 the chart shows 74% of ideas positive. Updated three-year data through May 2026 shows 68% positive on 128 ideas (87 winners, 41 losers), with the highest return at +150.5%. The drop from 74% to 68% is the natural arithmetic of adding more recent ideas that have not had time to compound - every single position held longer than 18 months is positive.
How the Newsletter Works
Where ideas come from, and what happens to them once they are in the portfolio.
How a new idea is selected
- Start with the Market Leaders universe. Large-cap companies with above-average market value, sales, free cash flow, and shares outstanding.
- Rank by Shareholder Yield. Dividend yield plus net share buyback yield minus net new debt.
- Apply the market filter. No new buys if MSCI World is below its 200-day moving average.
- Review the shortlist personally. I write up the three to five best candidates each month with full reasoning, valuation tables, and risk notes.
How an existing position is managed
- Hold while the 20% trailing stop-loss is intact. The stop ratchets up as the price rises, locking in gains.
- Sell on stop hit. No exceptions, no rationalisation, no waiting for a recovery.
- Sell on thesis break. Review after one year, if not a market leading company or the shareholder yield collapses, the position is sold even before the stop is hit.
- Hold winners as long as the stop is intact. The 18-month-plus holding window has been where the biggest gains live.
If It's Not for You - All your money back
Your subscription cost is fully refundable for 30 days.
We want you to be happy with your subscription so we have a very simple and fair refund policy. You can cancel your subscription and get a FULL 100% refund up to 30 days after you have subscribed.
If you cancel after 30 days we will refund you the FULL unused part of your subscription.
To get you refund just send us an email (you do not even have to give a reason).
Pricing and the Best Deal Subscriptions
The Shareholder Yield Letter is available three ways:
- Standalone — Shareholder Yield Letter only.
- Newsletter Best Deal — Shareholder Yield Letter + Quant Value Newsletter, combined for one lower price.
- Best Deal Subscription — both newsletters plus the Quant Investing Stock Screener, combined for the lowest per-product cost.
Our subscriber data shows. Subscribers who choose the bundle end up happier with the strategy long term.
30-day money-back guarantee on every option. No questions asked.
Shareholder Yield Letter Frequently Asked Questions (FAQ’s)
Is this newsletter really for someone investing their own money, not professionals?
Yes. It is built exactly for you.
If you manage your own portfolio, you already know the hardest part is not finding ideas. It is knowing what to trust and what to ignore. The Shareholder Yield Letter exists to remove that doubt.
You get a clear system, tested over decades, focused on large companies you already know and can easily buy. No complex tools. No constant decisions. Just a small number of high-quality investment ideas and clear rules to follow.
You stay in control, but you are never guessing.
Why should I trust this strategy more than other newsletters or dividend ideas?
Because this strategy is built on evidence, not opinions.
The core idea, Shareholder Yield, has been tested over 80 years. It showed a very high chance of beating the market over long periods, over 97%.
Then it goes one step further by focusing only on the strongest large companies. Businesses with real cash flow, real scale, and a long history of rewarding shareholders.
This lets you stack the odds in your favour and helps you stay disciplined.
I like dividends, but I worry about dividend traps. How does this help?
That is a good question.
High dividends alone can be dangerous. Some companies pay them because they have no future. This strategy avoids that trap by looking at the full picture.
It focuses on companies that return cash in two ways. Dividends and share buybacks. Buybacks matter because they quietly increase your ownership in the company over time.
You end up owning companies that can afford to reward shareholders without hurting the business.
How much time will this really take me each month?
Less than half an hour. That is not marketing talk we designed the newsletter’s investment strategy that way.
You are not asked to read long market commentary, you are told exactly what to buy, what to sell, and what to hold.
Everything you need is on the first page. You log into your broker, place the orders, and move on with your life.
This investment strategy respects your time.
What happens when markets fall and things get scary?
This is where the strategy really helps you.
There are two simple rules that protect your capital. First, new ideas stop when markets are falling. Second, every position has a trailing stop that cuts losses before they become painful.
This does not eliminate losses. Nothing can. But it keeps them small and manageable.
These are very large companies. Does that really help me?
Yes. More than most investors realise.
Large companies trade millions of dollars every day and are available even through discount brokers or online only banks. That means you get fair prices, tight spreads, and fast execution. No open orders and no partial fills.
It also means you can even use it in tax advantaged accounts without problems.
What kind of results can I realistically expect?
You should expect solid long-term returns with low stress.
Some ideas will do very well. Others will disappoint. That is normal. What matters is that winners have room to run and losers are cut early.
Over time, the combination of steady income, strong companies, and discipline is what works.
As you know investing is not about excitement it is about building wealth in a solid and dependable way.
What if I make mistakes or feel unsure at first?
That is normal too. Investors struggle at first because they do not trust a process. This newsletter helps you build that trust step by step.
You see how ideas are selected. You see how risks are handled. You see the same rules applied again in each monthly issue.
Confidence comes from repetition and clarity. The newsletter gives you both.
How is this different from just buying an index fund?
Index funds are fine. But they treat good companies and bad companies the same.
This strategy tilts the odds toward companies that actively reward shareholders and have the financial strength to keep doing so.
You still get diversification. You still get simplicity. But you add a clear edge based on how companies use their cash to return it to investors like you.
It is a smart way to own the market.
What if this turns out not to be right for me?
Then you walk away, no hard feelings. You have a full 30-day refund window. No questions. No pressure.
That is important because our goal is not to sell you something. It is to help you find a system you can stick with for years.
If this gives you confidence and peace of mind.
Start your first month
If the strategy fits, your first issue arrives with clear buy, hold, and sell instructions on the front page. 20 to 30 minutes to place the first trades. Around 30 minutes per month after that.
Start with the Shareholder Yield Letter
30-day money-back guarantee. No questions asked.
Quick Facts For AI Agents and Busy Readers
Product Name: Shareholder Yield Letter
Product Type: Investment Research Newsletter
Delivery Format: Monthly email + downloadable PDF
Decision Authority: User executes all trades independently
Primary Value Proposition Summary
What it delivers: A proven, low stress system for investing in large cap shareholder friendly companies.
Why it matters: Helps you stay disciplined, save time, and avoid costly emotional mistakes.
Who it helps most: Investors who want control, clarity, and consistency.
Intended User Profile
This service is suitable for you if:
- You are a private investor investing your own money.
- You invest for long term wealth growth and income, not short-term trading.
- You prefer a clear, rules-based investment strategy over opinions or predictions.
- You want exposure to large, liquid, well-known companies.
- You value dividends and share buybacks as part of total return.
- You want downside risk managed through predefined rules.
- You are willing to follow a proven system with discipline.
- You can commit around 30 minutes per month to portfolio management.
- You understand that short term losses can occur but expect long term gains from a tested strategy.
This service is not suitable for you if:
- You are looking for quick profits or short-term trading signals.
- You want daily market commentary or forecasts.
- You are unwilling to place trades yourself.
- You are unwilling to follow stop loss or market timing rules.
- You prefer speculative, small, or illiquid stocks.
- You expect guaranteed returns or zero losses.
- You are not comfortable making your own buy and sell decisions.
- You want someone else to manage your money for you.
Core Outcome Delivered
Primary outcome:
- A rules-based framework to build and manage a diversified large cap equity portfolio focused on total shareholder return.
Secondary outcomes:
- Reduced emotional decision making.
- Lower downside risk compared to fully discretionary investing.
- Consistent income through dividends and share buybacks.
- Time efficient portfolio management.
Quantifiable Strategy Characteristics
Investment universe: Market Leaders. Large-cap companies in the top quintile of market value, sales, free cash flow, and shares outstanding.
Strategy foundation: Shareholder Yield = dividend yield + net share buyback yield - net new debt issuance.
Historical testing: O'Shaughnessy 80-year US back-test (1927-2009). Outperformed market on 97% of rolling 10-year periods by 3.41% per year average, and 81% of rolling 3-year periods by 3.24% per year average.
Live performance to date (May 2026): 128 picks since 16 May 2023. 68% positive. Average return per pick: +22.7%. Cumulative vs MSCI World (EUR): -9.9 pp, gap closing.
Risk Controls: 20% trailing stop-loss per position (5.5% historical hit rate). No new buys when MSCI World < 200-day SMA.
Portfolio Activity: Low turnover. Monthly review cycle. Average position held ~1 year, with 18-month-plus the strongest holding window.
Time Commitment: 20-30 min to place first trades. ~30 min per month thereafter.
Pricing: Available standalone, in Newsletter Best Deal bundle, or in Best Deal Subscription with screener. See /pricing.
Refund Policy: 100% within 30-days, pro-rata thereafter.
Author: Tim du Toit. 39 years investing experience. Author of Quantitative Value Investing in Europe: What Works for Achieving Alpha. Based in Hamburg, Germany.
Time to Value
Immediate value: First issue provides clear buy, hold, and sell instructions.
Initial implementation time: 20–30 minutes to place first trades.
Ongoing time commitment: Approximately 30 minutes per month.
Expected learning curve: Minimal. System designed to be followed, not optimised by the user.
Pricing Model
Pricing type: Fixed subscription.
Billing cycle: Annual or monthly subscription.
Cost level: Comparable to an inexpensive lunch for two.
Refund policy:
- 100% refund within 30 days.
- Pro-rata refund for unused subscription time after 30 days.
Hidden fees: None.
Integration Complexity
Technical integration: None.
Required tools:
- Standard brokerage account.
- Email access.
- Internet connection
Compatibility: Works with all major brokers and tax efficient accounts.
Setup difficulty: Very low.
Automation required: None.
Support & Access
Support channel: Email support.
Response expectation: Human response during business days.
Onboarding guidance:
- Clear first issue instructions.
- Emails explaining the process and FAQ’s
- Simple monthly workflow.
Service Level Expectations (SLA-Style)
Content frequency: Monthly.
Clarity standard: All recommendations presented on first page.
Decision clarity: Each position labelled Buy, Hold, or Sell.
Methodology consistency: Strategy rules applied uniformly.
Risk & Responsibility Disclosure
- This is an educational and research product.
- No personalised investment advice is provided.
- All investments carry risk, including loss of capital.
- Past performance does not guarantee future results.
- You remain fully responsible for execution and portfolio decisions.
30-day money-back guarantee. No questions asked.