

Momentum helps you buy stocks rising for real reasons and not just hype. This guide shows how two simple numbers, the Price Index and Adjusted Slope, can help you ride trends early and avoid late entries. You will learn how momentum works, why it improves almost every strategy, and how to screen for it yourself - even as a beginner. Clear examples and backtests show how combining momentum with value and quality can increase your returns.
Estimated Reading time: 6 minutes
What Momentum Metrics Actually Mean (And How to Use Them)
You do not need to be an economist or hedge fund manager to use advanced momentum screening metrics as well as they do.
Why Momentum Matters
Let me tell you a quick story. Two investors buy the same stock. One jumps in while the stock is already rising. The other waits too long and buys at the top. The first investor makes a solid return. The second? Not so lucky. That is the power of momentum.
Momentum shows you how strong and steady a stock’s upward move is. If used right, it can help you enter at the right time and avoid buying too late.
In this post, you will learn what momentum metrics really mean, why they work, and how to use them in your own screener. To use them, you only need to understand three numbers.
What Is Momentum (And Why It Works)?
Momentum simply means that a stock going up often keeps going up. Stocks moving down often keep falling. That sounds too simple, but this pattern shows up again and again in the data. Why? Because investors chase performance. We follow trends. We fear missing out.
As a deep value investor, when I started investing, I did just the opposite - the more a stock fell the more I bought, and it cost me a lot of money in lost returns. It took a lot of research for me to start using momentum, and with this post, I would like to help you start using momentum for your benefit as well.
Academic studies and backtests support momentum investing. In fact, using momentum the right way has beaten the market many times over. It works not because of some hidden trick, but because of human behaviour. You can profit by investing along with this normal human behaviour.
The 2 Momentum Metrics That Matter Most
#1. Price Index (X Months)
This is the simplest one. The price index tells you how much a stock has gone up in the last 6 or 12 months. The screener includes momentum indicators from 1 month up to 5 years.
It is calculated as: Current Share Price ÷ Share Price X Months Ago
If a stock was $100 six months ago and it is now $130, the 6-month Price Index is 1.30. That means a 30% gain.
How Momentum Improved Returns of 13 Strategies
We tested momentum (6 and 12 months) with 13 other ratios to see if it could increase your returns.
What we found was remarkable!
The following table shows you how much the return of the stand-alone strategies was improved by selecting only from the 20% of companies with the highest 6-month momentum.
Six Months Momentum - Price Index 6m
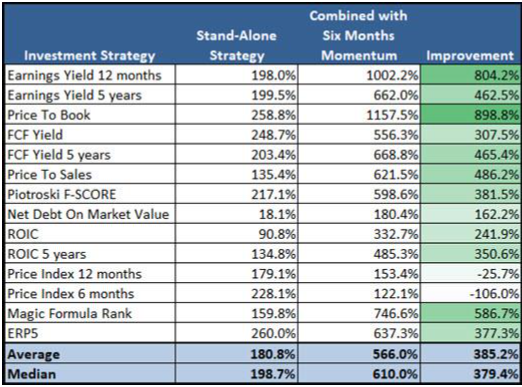
Click image to enlarge
Source: Quantitative Value Investing in Europe: What Works for Achieving Alpha
An Average 385% Improvement!
On average, if you combined 6 months' momentum with 13 other investment strategies, your returns would have increased just over 385%.
Let’s see what happened if you used 12 months' momentum.
Twelve Months Momentum - Price Index 12m
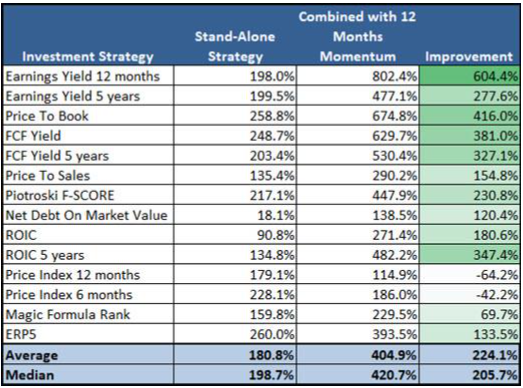
Click image to enlarge
Source: Quantitative Value Investing in Europe: What Works for Achieving Alpha
Average Returns Increased 224.1%
Also, with 12 months momentum returns were a lot higher. On average, the returns of all 13 ratios or strategies increased 224.1% over 12 years.
The same as with 6 months momentum, 12 months momentum (taking the top 20% of the already top 20% of momentum companies) did not give you higher returns.
#2. Adjusted Slope
This one sounds complex, but it is easy once you get the idea. The Adjusted Slope combines two things: how fast the price is going up, and how straight that path is. The formula is:
Annualized Slope × R² (trend × reliability)
Think of it like this: a steep hill with no bumps is better than a jagged mountain. You want strong, steady climbs, not roller-coaster stock price movements. This metric helps you spot smooth trends you can trust.
Market Beating Adjusted Slope Backtest
You can see a full backtest of the Adjusted slope investment strategy in this blog post: This easy-to-use adjusted slope momentum strategy performed 7 times better than the market
To start finding companies with Strong Momentum NOW! - Click here
How to Use These Metrics in a Screener
Beginner Strategy: Momentum Confirmation
Start simple. Filter for stocks with a 6-month Price Index above 1.25 or just select 0% to 20% with the sliders to get a list of companies with the best momentum. You are confirming the stock is on an upward trend.
Try this with the free version of the Quant Investing screener. The filters are easy to set. You will see stocks that are already moving up.
Intermediate Strategy: Smooth Slopes
Now add in Adjusted Slope. Look for values above 38. This tells you the stock is not just rising - it is doing it cleanly. Pair this with a filter for trading volume (say, above $150,000 daily) to avoid illiquid, hard to buy and sell stocks. Use the backtest feature in the screener to test this strategy. You can see how it performed in the past. That builds confidence before you invest.
Advanced Strategy: Momentum + Value
Here’s where it gets fun. Combine a high Adjusted Slope with low PE and a high Piotroski F-Score.
This lets you find stocks that are trending up, but still cheap and financially healthy. It can lead to strong returns with lower risk.
This is what the screen looks like:
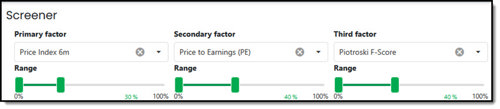
Source: Quant Investing Stock Screener
When Momentum Fails (And How to Avoid Traps)
Momentum is not magic. It can break. Stocks that rise too fast can crash even faster. This often happens around earnings reports, big news, or when the market turns.
To stop your losses fast when momentum turns down, use a stop-loss rule. If your stock falls 15% to 20% from the highest price since you bought it, sell it. This is one way we manage risk in our newsletters.
You can also use the 50-day moving average crossing below the 200-day average as a warning sign. That is called a “death cross”, a signal to get out.
Psychological Edge: Why Most Investors Misuse Momentum
Most people misuse momentum because they chase it. They see a stock that is already up 80% and think, “I better get in now.” That is not using momentum. That is gambling.
Smart momentum investors use data. They enter early but not too early. They combine momentum with quality and price. Most of all, they follow a system, not headlines, not fear, not excitement. You can be that kind of investor. The kind who uses momentum to find strong stocks before the crowd. The kind who leaves hype to others and sticks to their plan.
Final Takeaways: Your 2-Number Momentum Toolkit
As you have seen, you do not need a PhD to use momentum. You just need two numbers:
-
Price Index → shows how strong the move is.
-
Adjusted Slope → confirms how smooth and real the trend is.
Use them in a screener. Backtest before investing. And most important: trust your system, not your gut. Momentum is a tool. When you use it right, it puts the odds in your favour.
To start finding companies with Strong Momentum NOW! - Click here
FREQUENTLY ASKED QUESTIONS
1. What does “momentum” mean in investing?
Momentum means that a stock going up is likely to keep going up for a while. The same goes for stocks going down. It works because people follow trends. When used well, momentum helps you buy earlier in a rising trend and avoid buying too late.
2. Why should I care about momentum as a value investor?
Because ignoring momentum can cost you. Even if a stock is cheap, it might keep falling - a value trap. Momentum helps you buy when the stock is not only cheap but also going up. That gives you better timing and more return with less stress.
3. What is the “Price Index” and how do I use it?
The Price Index shows how much a stock has gained in 6 or 12 months. A value above 1.25 usually means strong momentum. You can filter for this in your screener to find stocks already trending upward. It is simple and effective.
4. What is the “Adjusted Slope” and why does it matter?
The Adjusted Slope measures how steady and strong a stock’s rise has been. A high slope means a smooth, reliable uptrend. It helps you avoid jumpy, risky stocks. Look for values above 38 for a good start.
5. How can I combine momentum with other strategies?
Start with momentum as your filter, then add value and quality. For example, combine a strong Adjusted Slope with a low PE and high Piotroski F-Score. That gives you stocks that are rising, cheap, and healthy.
6. Can momentum fail, and how do I protect myself?
Yes, momentum can break. Big news or market drops can flip trends fast. Use a stop-loss rule to limit losses. If your stock drops 15–20% from its high, consider selling. You can also watch for the “death cross” (50-day moving average falling below the 200-day).
7. What is the biggest mistake people make with momentum?
Chasing hype. Many investors jump in after a stock has already soared. That is not momentum - that is gambling. True momentum investing means using data and discipline. You follow a system. You do not follow headlines.
To start finding companies with Strong Momentum NOW! - Click here
