

In this post, you'll discover how stock price momentum—a concept often overlooked by long-term investors—can significantly increase your returns.
By understanding how momentum works and seeing the results from a detailed 12-year back test, you'll learn how to integrate this powerful strategy into your own investments.
The article also shows you how combining momentum with other strategies can amplify your gains, helping you make smarter, more profitable decisions. Reading this could be the key to unlocking higher returns in your portfolio.
Estimated Reading Time: 6 minutes
Other Interesting Momentum Articles
10 myths about momentum investing, squashed
How to find stocks on the move with a better momentum indicator - exponential regression
Meet the Momentum Composite Indicator! Your key to finding high momentum low volatility stocks
How Momentum Can Help You Beat the Market - Research Proven
Mastering Dual Momentum: The Art of Combining Absolute and Relative Strength
Meet The Magic Formula 2.0 With Momentum
Stock price momentum matters, can improve your returns a LOT! This is what I would like to prove to you with this momentum back test.
And if you think stock price momentum (also called Price Index) is something only traders use and is of no use to long-term investors (including value investors) then you must read this article.
Momentum is a Good Idea
After testing 168 investment strategies over 12 years and writing the research paper Quantitative Value Investing in Europe: What works for achieving alpha, I become a BIG supporter of using positive stock price momentum as one of the factors I use when looking for investment ideas.
The reason is it works! Even though I did not want to believe it at first.
A Simple Idea
All the testing proved the basic idea behind momentum is true.
Once the stock price goes up or down (numerous research studies using up to 100 years of data have proven) that it continues to move in that direction.
What is Momentum and How is it Calculated?
Stock price momentum is simply the movement of the stock price over a certain period.
For example in the Quant Investing screener we calculate 12 months momentum (Price Index (PI) 12m) as the current stock price / stock price 12 months ago. This allows you to easily and quickly sort companies by share price momentum, the higher the better.
The screener has momentum (or price index) available on all companies from 1 month up to 60 months for you to use.
The Back Test
In the research paper report we tested momentum extensively over the 12-year test period from 13 June 1999 to 13 June 2011.
Before I show you the results first some information on exactly what and how we tested.
Back Test Universe and Benchmark
Our back test universe was a subset of companies in the Datastream database containing an average of about 1500 companies in the 17 country Eurozone market during our 12-year test period (13 June 1999 to 13 June 2011).
We excluded banks, insurance companies, investment funds, certain holdings companies, and REITS.
We included bankrupt companies to avoid any survivor bias. For bankrupt companies or companies that were taken over returns were calculated using the last stock market price available before the company was delisted.
We excluded companies with an average 30-day trading volume of less than €10,000.
Not a Good Time to Invest in Stocks
Even though the test period was not long it was not a good time to be invested in stocks. The 12-year period included a stock market bubble (1999), two recessions (2001, 2008-2009) and two bear markets (2001-2003, 2007-2009).
Over the whole test period it was essentially a sideways market with some big movements which made it a great period to test momentum.
Holding Periods and Quintile Tests
Each year all the portfolios were formed on 16 June. We chose 16 June as most European companies have a December year-end and by this date all their previous year-end results would be available in the database.
The annual returns for our back test portfolios were calculated as the 12-month price change plus dividends received over the period. Returns were compounded on an annual basis.
This means each year the return of the portfolio (dividends included) would be reinvested in the strategy the following year.
The portfolios were all constructed on an equal-weight basis. In order to test the effectiveness of a strategy, we divided our back test universe into five equal groups (quintiles), according to the factor we were testing.
For example, when testing momentum we ranked our back test universe from the best – stocks with the largest price increase - to the worst – stocks with the biggest price fall.
The best 20% of companies were put in the first quintile (Q1), the next in the second, and so on, with the 20% of companies with the worse momentum (biggest price fall)in the fifth quintile (Q5).
Returns and Improvements
We tested both single ratios and a combination of ratios. As you will see single ratio returns can be substantially improved by adding a second ratio.
But before we get to that here are the back tested returns you could have earned if you only used a momentum investment strategy to invest in Europe over the 12 year period 13 June 1999 to 13 June 2011.
Six months momentum (Price Index 6m) back test:
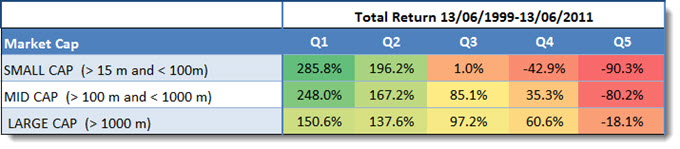
Source: Quantitative Value Investing in Europe: What works for achieving alpha
Twelve months momentum (Price Index 12m) back test:
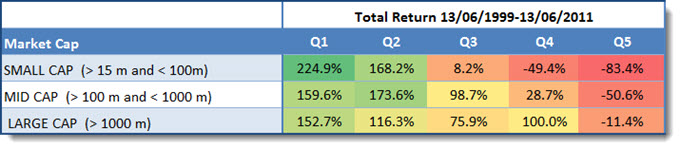
Source: Quantitative Value Investing in Europe: What works for achieving alpha
Q1 (Quintile 1) shows the 20% of companies with the best momentum or Price Index (share price has gone up the most) and Q5 (Quintile 5) companies with the lowest Price Index (share price has gone down the most).
Market Return Only +30.54%
As you can see momentum worked, with the best momentum companies substantially outperforming the worse momentum companies. The strategies worked best for small companies.
The best strategies (Q1) also substantially outperformed the market, which over the same 12 year period returned 30.54%.
Run Your Own Momentum Back Tests
The screener's historical back tester lets you test momentum strategies across different time periods, markets, and holding periods. See for yourself how the results in this article hold up with different parameters and in different regions.
Back Test Momentum Strategies With Historical Data
No credit card needed. Cancels automatically after 30 days.
How Momentum Improved other Investment Strategies
We also tested momentum (6 and 12 months) with 13 other ratios to see if it could increase your returns.
What we found was remarkable!
The following table shows you how much the return of the stand-alone strategies were improved by selecting only from the 20% of companies with the highest 6 months momentum.
Six Months Momentum
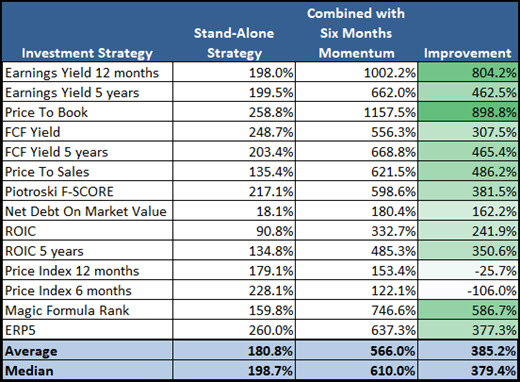
Click image to enlarge
Source: Quantitative Value Investing in Europe: What Works for Achieving Alpha
An Average 385% Improvement!
On average if you combined 6 months momentum with 13 other investment strategies your returns would have increased just over 385%.
Most Improved Strategy = Momentum + Price to Book +1157.5%
The strategy combined with the best momentum companies that gave the best returns over the 12 year period was Price to Book value which returned just over 1,157%.
This may have been because the test period contained two market crashes (internet bubble and the 2008 financial crisis) after which a low price to book strategy usually does very well.
However, be careful of a low price to book investment strategy because it has long periods of market underperformance. You can read more about it here: Be careful of this time tested value ratio
Let’s see what happened if you used 12 months momentum.
Twelve Months Momentum
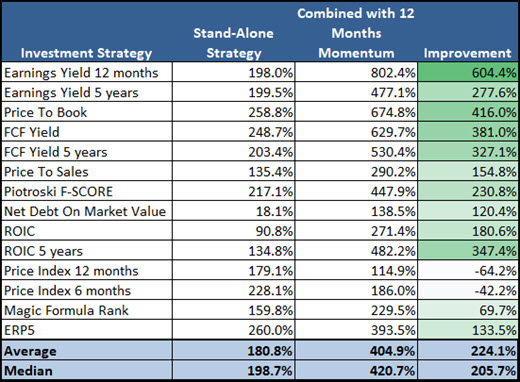
Click image to enlarge
Source: Quantitative Value Investing in Europe: What Works for Achieving Alpha
Average Returns Increased 224.1%
Also with 12 months momentum returns were a lot higher. On average the returns of all 13 ratios or strategies increased 224.1% over 12 years.
The same as with 6 months momentum, 12 months momentum (taking the top 20% of the already top 20% of momentum companies) did not give you higher returns.
Most Improved Strategy = Momentum + Earnings Yield 12 months +604.4%
Twelve months momentum was able to add 604.4% to the return of a strategy that bought only companies with the Earnings Yield (EBIT to Enterprise Value).
Adding Momentum can Substantially Increase Your Returns
As you saw adding momentum to your investment strategy can increase your returns substantially.
With momentum you are investing in a company with a better performing stock price than the other companies (better relative momentum) and that's where its real value lies.
How to Add Momentum to Your Investment Strategy
In the Quant Investing stock screener it's really easy to add momentum to how you search for investment ideas.
In the screener momentum is called Price Index and values from one month to 60 months are available including 12-1 month momentum.
You can find the exact definitions of all momentum indicators in the screener glossary.
How to Find Good Momentum Companies
You can add momentum called Price Index by using one of the four sliders as the following screenshot shows.
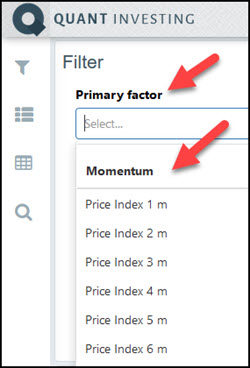
Select the Price Index value you want to use under the heading Primary Factor from the drop down list under the Momentum heading. To select only the 20% of companies with the best momentum (biggest stock price increase) move the slider to select 0% to 20%.
It’s as easy as that to add momentum to the way you search for investment ideas.
You can read more about the screener here: about the Quant Investing stock screener
Summary and Conclusion
As you saw you can increase your returns substantially by adding only companies with positive momentum to your existing investment strategy.
It increased the returns of 11of the 13 investment strategies by an average of over 385% over a 12 year period.
Screen for Today's Strongest Momentum Stocks
The backtest shows momentum works over the long term. Use the screener to find which stocks have the strongest momentum right now — filter by price index, adjusted slope, and momentum composite across 22,000+ companies worldwide.
Find High-Momentum Stocks Globally
No credit card needed. Cancels automatically after 30 days.
Frequently Asked Questions
1. What is stock price momentum?
Momentum measures a stock’s price movement over time. If a stock’s price rises, it tends to keep rising.
2. Why should I care about momentum?
Adding momentum to your strategy can boost returns significantly. Stocks with strong momentum often keep on outperforming.
3. Is momentum only for traders?
No, long-term investors can benefit from momentum too. It helps identify strong-performing stocks and helps you avoid value traps.
4. How do I calculate momentum?
It’s the current price divided by the price in the past, for example, from 12 months ago. Higher values mean better momentum.
5. What’s the best holding period for momentum?
Testing shows 6 and 12 months work well. They offer consistent performance improvements.
6. Does momentum work in tough markets?
Yes, it’s been tested in sideways markets and during recessions, still showing strong results.
7. How does momentum compare to market returns?
Momentum strategies often beat the market, especially with small companies.
8. Can I combine momentum with other strategies?
Absolutely. Combining momentum with other factors can multiply your returns.
10. What’s the biggest risk with momentum investing?
Momentum can reverse quickly. It’s crucial to monitor and adjust your strategy, and use a strategy to keep losses low.
