

Last updated: June 2026
Quant Value vs Shareholder Yield, in one line:
Two Quant Investing newsletters tested side by side from 16 May 2023 to 29 May 2026. Quant Value buys small, cheap, out-of-favour companies. Shareholder Yield buys large companies returning cash through dividends and buybacks. Over this window Shareholder Yield returned more (+47.1% vs +38.2% in euros), but splitting your money 50/50 across both gave the best return for the risk taken..
I wanted to answer a question I get from subscribers all the time: if you can only follow one of our two newsletters, which should it be? So I ran the numbers properly.
I took the day the Shareholder Yield newsletter launched, 16 May 2023, and tracked both newsletters from an empty start to 29 May 2026. Every buy and every sell, exactly as a brand-new subscriber would have done it. Then I tested a third option: owning both, half your money in each.
Shareholder Yield made the most money. Quant Value gave the calmer ride in euros. And owning both beat either one on the measure that matters most, the return you got for the risk you took. Here is the full picture, in plain English, with every term explained at the bottom if you want it.
The headline numbers
- In euros, Shareholder Yield returned +47.1%, Quant Value +38.2%, and the 50/50 blend +43.0% over the 3 years.
- The blend had the best return-for-risk score of the three: a Sharpe ratio of 2.15 against 1.76 for Quant Value and 1.62 for Shareholder Yield, with the lowest bumpiness at 5.7%.
- The two newsletters barely move together. Their correlation was just 0.21 in euros. In 14 of the 36 months, one rose while the other fell.
- Quant Value made money on about 37% of its picks; Shareholder Yield on about 70%. The two own almost entirely different companies.
- In US dollars every figure is higher (Shareholder Yield +65.5%, Quant Value +46.4%, blend +56.0%) because the dollar weakened over the 3 years.
The experiment, in one paragraph
Imagine two separate pots of money on the day the Shareholder Yield newsletter started. Into the first you put 100,000 euros (or dollars) and follow the Quant Value newsletter. Into the second you put another 100,000 and follow the Shareholder Yield newsletter. Each time a newsletter says buy, you buy. Each time it says sell, you sell. You start with nothing and build each portfolio up from scratch, exactly as a new subscriber would. The question: how did each pot do, and would you have been better off splitting your money across both?
What the two newsletters do
Quant Value hunts for small, unfashionable, cheap companies, often obscure names you have never heard of. Most of its ideas go nowhere. A handful turn into very big winners, and the losers are sold quickly before they do much damage.
Shareholder Yield buys large, well-known companies that hand a lot of cash back to their owners, through dividends (cash paid to shareholders) and share buybacks (the company buying back its own shares, which makes each remaining share worth more). Most of its picks work out and pay stable, relatively high dividends. The idea was popularised by Mebane Faber, who showed that companies returning the most cash beat the market over long tests.
Results in Euros
The chart below shows how each 100,000 euro pot grew. Every line starts at 100, so they are easy to compare. A line reaching 147 means that pot grew by 47%. The dashed line is the own-both 50/50 blend.
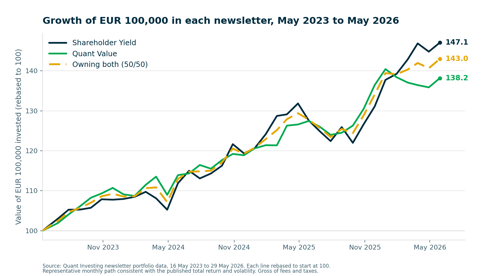
Growth of 100,000 euros in each newsletter, May 2023 to May 2026 (each line rebased to start at 100).
| Measure | Quant Value | Shareholder Yield | Owning both |
|---|---|---|---|
| Total return | +38.2% | +47.1% | +43.0% |
| Yearly rate (CAGR) | 11.4% | 13.7% | 12.7% |
| Volatility (bumpiness) | 6.3% | 8.2% | 5.7% |
| Worst dip (drawdown) | -3.7% | -7.5% | -4.7% |
| Return for risk (Sharpe) | 1.76 | 1.62 | 2.15 |
| Months that rose | 69% | 69% | 75% |
How to read this: in euros, Shareholder Yield made more money (+47% vs +38%), but Quant Value did it with a smoother ride: less bumpiness and a much shallower worst dip.
The striking number is the last column's Sharpe of 2.15. Owning both scored better on return-for-risk than either newsletter alone, because the blend's bumpiness (5.7%) is lower than either one on its own. That is diversification doing its job.
See the current Quant Value and Shareholder Yield picks
This test ran on the real picks each newsletter published, every buy and sell since 16 May 2023. A subscription gives you both newsletters, so you can run the same own-both split yourself from this month's picks.
Available with every subscription. 100% money-back guarantee for the first 30 days.
Results in US dollars
The same experiment, counting the money in dollars. Both newsletters mostly buy non-US companies (European, British, Japanese, Australian), so the exchange rate matters. Over these 3 years the dollar weakened, so the same holdings are worth more measured in dollars. That is why every number below is higher than its euro twin.
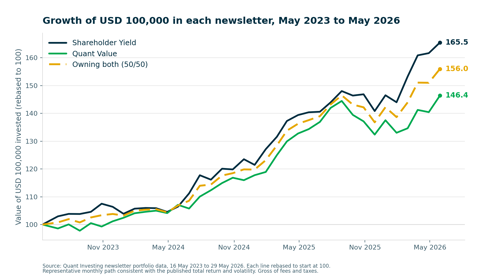
Growth of 100,000 US dollars in each newsletter, May 2023 to May 2026 (each line rebased to start at 100).
| Measure | Quant Value | Shareholder Yield | Owning both |
|---|---|---|---|
| Total return | +46.4% | +65.5% | +56.0% |
| Yearly rate (CAGR) | 13.5% | 18.3% | 16.0% |
| Volatility (bumpiness) | 8.0% | 8.5% | 7.2% |
| Worst dip (drawdown) | -8.3% | -4.7% | -6.3% |
| Return for risk (Sharpe) | 1.63 | 2.04 | 2.10 |
| Months that rose | 67% | 78% | 72% |
How to read this: in dollars the rankings shuffle. Shareholder Yield now has the smoother ride and the shallower dip as well, on top of the bigger return. But the headline holds: owning both still has the best return-for-risk score (2.10) and the lowest bumpiness of the three. The currency you measure in changes the exact figures. It does not change the conclusion that combining the two was the smoothest way to invest.
Quant Value vs Shareholder Yield: which should you pick?
If you want the bigger headline return and you can sit through a slightly deeper dip, Shareholder Yield led over this stretch in both currencies. If you want the calmer ride, Quant Value gave the shallower drawdown and lower bumpiness in euros. If you do not want to bet on which style wins next, own both. The blend gave up a little of Shareholder Yield's return in exchange for the smoothest ride and the best return-for-risk score of the three options, in euros and in dollars.
The best and worst individual picks
A few companies did the heavy lifting. A few dragged. These are the standouts, in euros.
Quant Value
Biggest winners: Celestica +333%, AlzChem +162%, Karrie International +146%, Johnson Electric +146%, Techpoint +119%.
Biggest losers: Cross Country Healthcare -33%, Mitani -31%, Aztech Global -29%, JFE Systems -29%, Evertz -28%.
The pattern: only about 37% of Quant Value's picks made money, and the typical pick barely moved. But the winners ran enormously far while losers were cut at around -30% or less. A few big winners pay for many small disappointments.
Shareholder Yield
Biggest winners: Barclays +161%, British American Tobacco +109%, Chow Tai Fook +105%, Altria +88%, Aker BP +88%.
Biggest losers: PayPal -40%, B&M European Value -37%, Stellantis -35%, Nexi -27%, Fortescue -25%.
The pattern: about 70% of its picks made money with a healthy typical gain. But the occasional loser fell further than Quant Value's did. Most things work, and mistakes sting.
Look at the two lists. They share almost no companies. Quant Value owns obscure small-caps, Shareholder Yield owns household names. That lack of overlap is exactly why holding both adds real variety rather than doubling up on the same bets.
Why owning both worked better
The single most important finding is how little the two newsletters move together. Their correlation was just 0.21 in euros (0.53 in dollars). A correlation of 0 means they move independently, 1 means lockstep, so 0.21 is very loosely linked.
In plain terms: when one newsletter was having a bad month, the other was often having a good one. Across the 3 years, in 14 of the 36 months one newsletter rose while the other fell.
That is what powers the own-both result. Because their wobbles partly cancel out, the 50/50 blend was less bumpy than either newsletter on its own, while its return landed comfortably between the two. Smoother ride, middle-of-the-road return, and so the best return-for-risk score of all three, in both currencies. This is the same reason holding a sensible number of positions that do not move together beats concentrating your bets.
The practical takeaways:
- You do not have to guess which style wins. Shareholder Yield led over this stretch, but Quant Value delivered the single biggest winners and the calmer ride in euros. Owning both means you do not have to pick correctly in advance.
- They cushion each other. Because they are only loosely linked, a stumble in one was frequently offset by the other. That is why the blend's worst dip and bumpiness were so well contained.
- Better reward for the risk taken. The blend earned roughly 13% to 16% a year at lower bumpiness than either alone, lifting the return-for-risk score above both.
- No doubling-up. The two own almost entirely different companies, so combining them genuinely broadens the net rather than concentrating the same bets.
Honest caveats
- This is one specific 3-year window, and it was mostly a rising market. It is not a deep test of how the two behave in a sustained crash.
- No trading costs, fees, or taxes are included. Real-world returns would be somewhat lower.
- The dollar figures were flattered by the dollar weakening against other currencies. That tailwind is an accident of the exchange rate, not something either newsletter controls or can be counted on to repeat.
- Owning both here means a tidy 50/50 split rebalanced monthly. A real investor's split and timing would differ.
The bottom line
Both newsletters made good money over the 3 years. They get there in opposite ways. Quant Value through a few huge winners among many quiet picks, Shareholder Yield through a high proportion of steady winners.
Because they rarely stumble at the same time, splitting your money across both gave the smoothest ride and the best reward-for-risk of any option, whether you counted the money in euros or dollars.
Own both newsletters from one subscription
The data above is one 3-year window in a mostly rising market, so treat it as a guide rather than a promise. If you want the own-both ride the numbers point to, a single subscription gives you the monthly Quant Value and Shareholder Yield picks, the buy and sell alerts, and the screener behind them.
See what a subscription includes
Available with every subscription. 100% money-back guarantee for the first 30 days.
Frequently asked questions
1. Which performed better, Quant Value or Shareholder Yield?
Over 16 May 2023 to 29 May 2026, Shareholder Yield returned more: +47.1% vs +38.2% in euros, and +65.5% vs +46.4% in US dollars. Quant Value gave the smoother ride in euros, with a worst dip of only -3.7% against Shareholder Yield's -7.5%.
2. Is it better to own both newsletters?
On the numbers, yes, if you care about return for risk. The 50/50 blend had the best Sharpe ratio of the three (2.15 in euros, 2.10 in dollars) and the lowest volatility (5.7% in euros), because the two newsletters have a correlation of just 0.21 and rarely fall at the same time.
3. What is the difference between the two strategies?
Quant Value buys small, cheap, out-of-favour companies. About 37% of picks made money, with a few huge winners carrying the rest. Shareholder Yield buys large companies returning cash through dividends and buybacks. About 70% of picks made money, with steadier but smaller gains.
4. Why are the US dollar returns higher than the euro returns?
Both newsletters mostly hold non-US companies. The dollar weakened over the 3 years, so those holdings are worth more when measured in dollars. The currency you report in changes the figures, not the ranking of the three options.
5. What was the worst drawdown?
In euros, the worst peak-to-trough dip was -3.7% for Quant Value, -7.5% for Shareholder Yield, and -4.7% for the 50/50 blend. The blend's dip sat between the two, not at the worst extreme.
6. Do these returns include fees and taxes?
No. The figures are gross of trading costs, fees, and taxes, so your real-world return would be somewhat lower. The test also covers one mostly-rising 3-year window, so treat it as a guide, not a forecast.
Every term used here:
Total return: how much the pot grew over the whole period, start to finish. "+47%" means 100,000 euros became 147,000.
CAGR (compound annual growth rate): the same growth expressed as a smooth yearly rate. It answers, what steady annual return would have produced this result? A bumpy +47% over 3 years works out to about +13.7% a year.
Volatility: how bumpy the ride was, how much the value jumped around month to month. Lower means a smoother, calmer journey. It measures the size of the wobbles. Direction does not come into it.
Maximum drawdown: the worst peak-to-trough drop along the way, the biggest fall from a high point before recovering. "-7.5%" means that at the scariest moment the pot was 7.5% below its previous best.
Sharpe ratio: return for each unit of bumpiness, a return-for-risk score. It rewards making money smoothly and penalises making the same money through a stomach-churning ride. Higher is better. Above 1 is good, above 2 is excellent.
Win rate / hit ratio: how often things went up. Monthly win rate is the share of months the pot rose. Pick hit ratio is the share of individual company picks that made money.
Correlation: whether two things tend to move together. It runs from +1 (they rise and fall in lockstep) through 0 (they move independently) to -1 (when one zigs, the other zags). This is the key to diversification.
Diversification: the do-not-put-all-your-eggs-in-one-basket effect. If you hold two things that do not move in step, their ups and downs partly cancel out, so the combination is steadier than either one alone, often without giving up much return.
The 50/50 blend: splitting your money evenly between the two newsletters, half in each, and rebalancing back to 50/50 each month. This is the own-both option we test against owning just one.
About the author. Tim du Toit has been investing since 1987. He founded Quant Investing and writes the Quant Value and Shareholder Yield newsletters for self-directed investors. The figures in this article come from Quant Investing's own newsletter portfolio records, covering every pick from 16 May 2023 to 29 May 2026.
