
This article shows you how (step by step) to implement a shareholder yield investment strategy in your portfolio. It also shows you why it’s a great investment strategy through the summary of all the back tests we could find.
What is a shareholder yield investment strategy?
The shareholder yield investment strategy uses the three ways a company can return cash to shareholders:
- Cash dividends,
- Stock repurchases and
- Debt reduction,
to find investment ideas.
Who invented it?
According to Wikipedia the term shareholder yield was first used by William W. Priest of Epoch Investment Partners in a 2005 paper called The Case for Shareholder Yield as a Dominant Driver of Future Equity Returns.
Shareholder yield was also mentioned in the 2007 book, Free Cash Flow and Shareholder Yield: New Priorities for the Global Investor, by William Priest and Lindsay McClelland.
So does a shareholder yield investment strategy work?
I am sure before you start using the shareholder yield investment strategy you want to make sure that it works.
So let’s look at the back test results.
Back test #1 – 80 Year back test of shareholder yield in the USA
In the great September 2017 article 7 Traits for Investing Greatness Jim O'Shaughnessy summarised an 80 year (1927–2009) back test of the shareholder yield investment strategy.
In the article Jim wrote:
“In the stock market, I believe the surest way forward is to look at the long-term results for an investment strategy and how often — and by what magnitude — it beat its underlying benchmark.”
The following table shows you the results of simply buying the 10% of large stocks with the highest Shareholder Yield (dividend yield plus net stock buybacks) over an 80-year back test period:
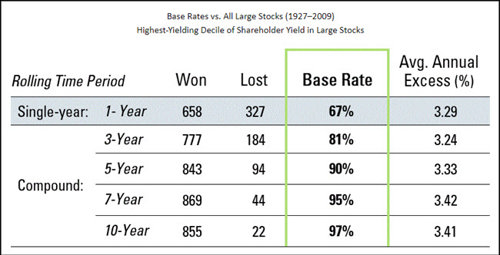
Source: 7 Traits for Investing Greatness
Over all 961 (777+184) rolling 3-year periods, the top 10% Shareholder Yield companies beat other large stocks 81% of the time by an average 3.24% per year.
If you extend the test to all 877 (855+22) rolling 10-year periods, you would have beaten the market 97% of the time by 3.41% per year.
That is an outstanding result!
The Shareholder Yield Letter does all the work for you! - Click here for more info
Back test #2 – How to improve the shareholder yield investment strategy 17 year US back test
In the article Quant investing: improving the value of shareholder yield my friend Paul Novel tested the shareholder yield investment strategy in in the US markets over the 17 year period from 1999 to 2016.
He first tested a high shareholder yield investment strategy against the S&P 500 over 17 years. This is what he found:
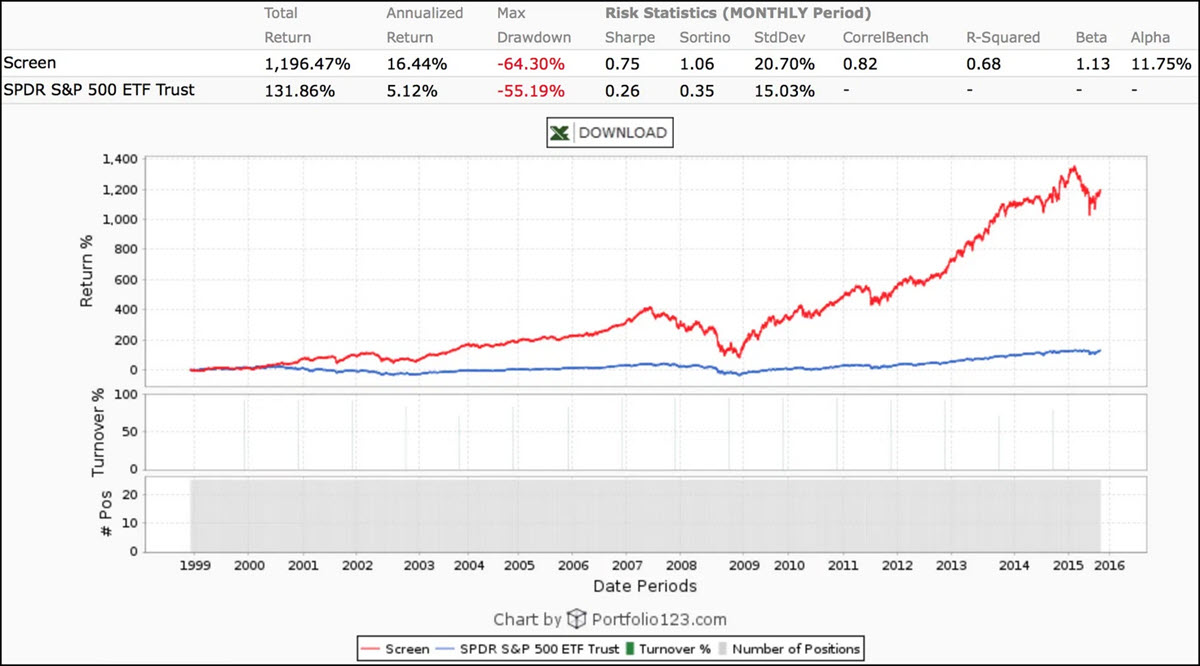
Click Image to enlarge
Source: Quant investing: improving the value of shareholder yield
As you can see the strategy outperformed the S&P 500 quite nicely earning 16.44% per year since 1999 with a Sharpe ratio of 0.75 and Sortino ratio of 1.06.
Adding high conviction buy backs
Paul then tested the same strategy but included only companies making high conviction stock buybacks which means they have a buyback yield greater than 5%.
Here are the results:
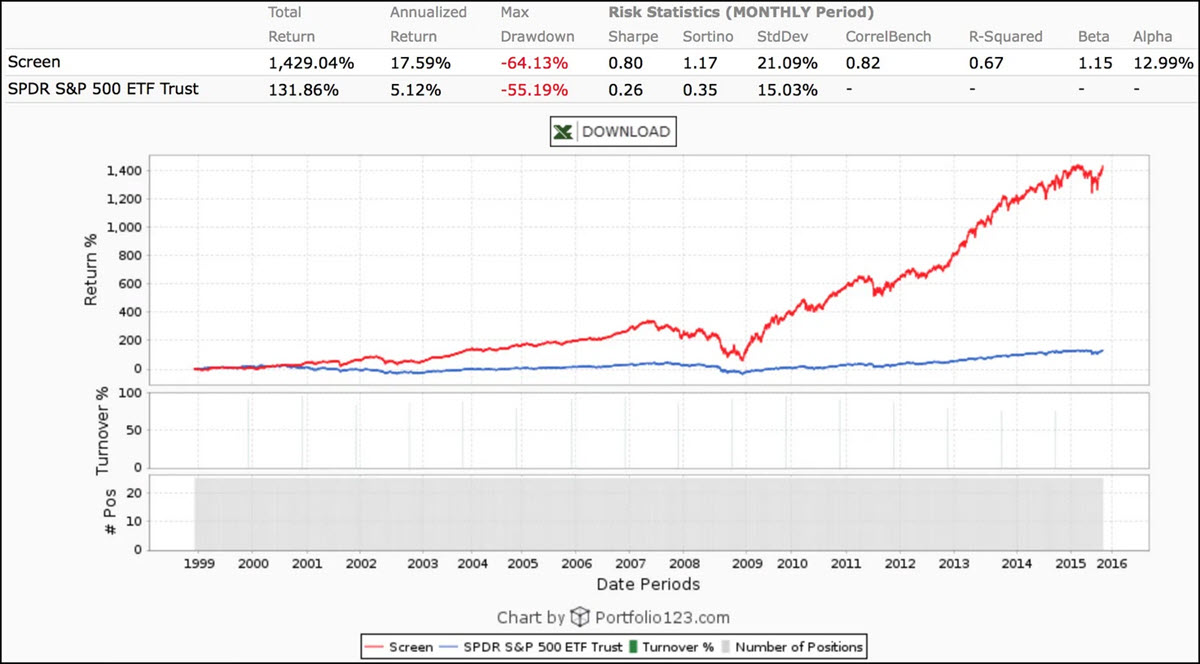
Click Image to enlarge
Source: Quant investing: improving the value of shareholder yield
As you can see yearly returns increased 1.15% from 16.44% to 17.59% per year since 1999. This may not sound like a lot but it is. Remember the increase is a "yearly increase" over 17 years. It results in the overall return increasing from 1196.5% to 1429% a 232.5% improvement over the 17 years.
As you can see, screening for high conviction buybacks (>5%) is a great improvement to the large cap shareholder yield investment strategy.
The Shareholder Yield Letter does all the work for you! - Click here for more info
Back test #3 – 32 Year Shareholder Yield US Large Cap Value investment strategy back test
In the September 2019 research paper called Shareholder Yield: A Differentiated Approach to an ‘Efficient’ Market – US Large Cap Value O’Shaughnessy Asset Management tested the Shareholder Yield investment strategy over 32 years.
They also tested a few improvements you can make to the strategy.
Back test definitions
In the back test they defined the indicators they tested as follows:
- Shareholder Yield is the sum of a stock’s dividend yield (paid over previous twelve months minus special dividends) and the percentage of net share buybacks over the previous twelve months.
- Quality earnings = Year over year percentage change in total accruals.
How the Shareholder Yield investment strategies performed
The following charts show the 32 year growth of $1 invested in 1982 in the following four large cap investment strategies:
- S&P 500
- Top 10% of large stocks by Dividend Yield
- Top 10% of large stocks by Shareholder Yield (dividends + buybacks)
- Top 10% of large stocks by Shareholder Yield after eliminating the half of the stock universe with the highest valuation and poorest quality
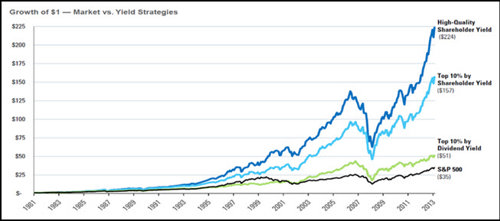
Source: Shareholder Yield: A Differentiated Approach to an ‘Efficient’ Market – US Large Cap Value
As you can see a shareholder yield investment strategy works, with quality undervalued shareholder yield companies generating the best returns.
The Shareholder Yield Letter does all the work for you! - Click here for more info
Back test #4 – What if you replace Dividend Yield with Shareholder Yield
JP Morgan Cazenove in their 23 April 2013 publication Quant Forensics: Volume 5 Europe Equity Research researched if replacing Dividend Yield with Shareholder Yield could improve the performance of a defensive investment strategy.
They defined shareholder yield as (dividends + net debt change + Net repurchases) / Market Value - and tested the strategy over the 12 year period from 2000 to 2012.
Here are the results of shareholder yield compared to dividend yield investment strategy in Europe and the USA.
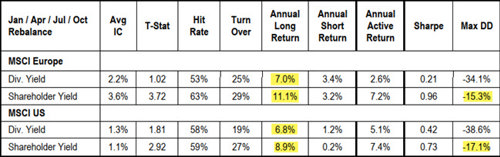
Source: JP Morgan Cazenove 23 April 2013 Quant Forensics: Volume 5 Europe Equity Research
Returns up 50% max draw down down 50%
As you can see annual long returns increased substantially compared to a dividend yield investment strategy. Also the maximum drawdown declined by 50%.
What is not to like about that!
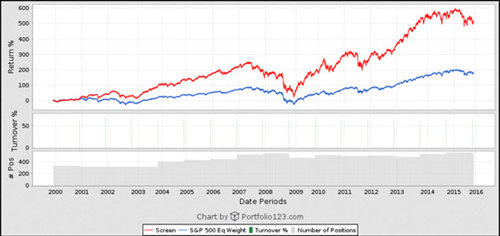
Back test #5 – 15 year US Shareholder Yield Large Cap investment strategy back test
George at Fat Pitch Financials in an article called Mebane Faber Shareholder Yield Backtest tested the shareholder yield investment strategy over the 15 year period from 2000 to 2015.
George defined shareholder yield as = (Dividends Paid TTM + (Total Debt PYQ – Total Debt Q) + (Equity Purchased TTM – Equity Issued TTM))/ Market Capitalization
TTM = Trailing 12 months
PYQ = Prior year quarter
Q = This quarter
He also set the following screening criteria:
- No OTC stocks. Stocks not traded on the New York Stock Exchange, NASDAQ, or American Stock Exchange markets are excluded.
- No ADRs. Fundamental data for foreign American Depository Receipt can include errors due to currency exchange, different accounting standards, and share count.
- Liquidity test. The minimum daily total amount traded over the past 42 trading days must be larger than $100,000.
- Market Cap > $50 million. Nano cap stocks are excluded to help improve data quality. This filter also ensures that positions in a modest sized portfolio never exceed one percent of shares outstanding or the available float for a company.
- Price > $1. True penny stocks are excluded due to various information issues and manipulation of these stocks.
- Shareholder Yield = NA. He wanted to make sure he was only looking at companies that have valid data for the components of shareholder yield.
As you can see in the chart below the top 20% of stocks as ranked by shareholder yield (Screen or red line in the chart) outperformed the benchmark over the 15 year period from 2000 to 2015.
The Shareholder Yield Letter does all the work for you! - Click here for more info
Back test #6 – Do long-term shareholder yield calculations increase returns?
In June 2014 AlphaArchitect published an interesting research paper Shareholder Yield: Do longer-term calculations enhance performance?
In the paper they wanted to find out if a shareholder yield calculated over a longer period, up to eight years, increased returns compared to the normal one year historical calculation.
They selected stocks that they could calculate a shareholder yield value for 8 years and back tested a look-back period of between 1 and 8 years.
A one year look-back had 1 value, while an 8 year look-back had 8 values. These numerators are then divided by the current market price to generate a shareholder yield measure.
Details of the back test:
- Portfolios are formed on June 30th each year and held for one year
- They tested 1yr, 2yr, …8yr versions of shareholder yield
- They formed quintile portfolios (20% of companies) based on the shareholder yield average (Quintile 5 is high yield, Quintile 1 is low yield).
- Returns are buy-and-hold, with a 1% management fee.
This is what they found:
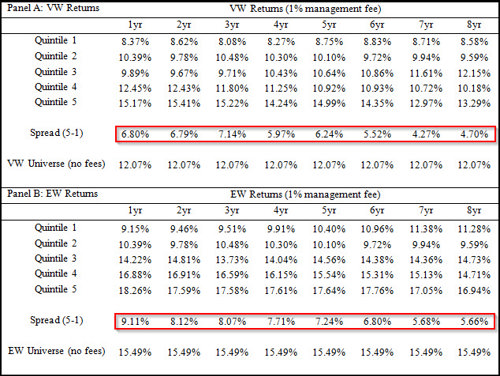
Overall, long-term shareholder yield calculations lowered performance, as you can see by the difference between high (Quintile 5) and low (Quintile 1) shareholder yields decreases as you use longer-term shareholder yield (look at row Spread 5-1).
So as you can see there is no benefit to using longer-term shareholder yield ratios.
You can thus say that a company’s longer term shareholder yield track record counts for nothing when it comes to returns.
Summary and conclusion
Before I show you exactly how to implement a shareholder yield investment strategy in your portfolio let’s look at what you can learn from all the above back tests:
- It works best for large companies
- Looking for high conviction buyback yield (greater than 5%) increases returns
- Selecting only from the 50% of companies with quality earnings (lowest year over year percentage change in total accruals) increases returns
- Selecting only from the 50% of companies with the lowest valuation increases returns
- The shareholder yield investment strategy outperforms the market in the USA and in Europe
- A high shareholder yield investment strategy substantially outperforms the market and has lower maximum drawdowns than a dividend yield investment strategy
- Long term shareholder yield calculations do not add to returns. Use trailing 12 months
How to implement a shareholder yield strategy in your portfolio
The Quant Investing stock screener makes it very easy to find high Shareholder Yield companies.
We have saved everything for you
To make it even easier we have already saved a screen, with all the ideas mentioned above for you.
All you have to do is load the screen with a few mouse clicks. This is how you do it:
- Log into the screener
- Click on the screener icon (small funnel) at the top left of the page
- Click the Load button
- Click the Predefined screeners tab
- Scroll down until you find the Shareholder Yield screen, click on it
- Click the Confirm button to load the screen
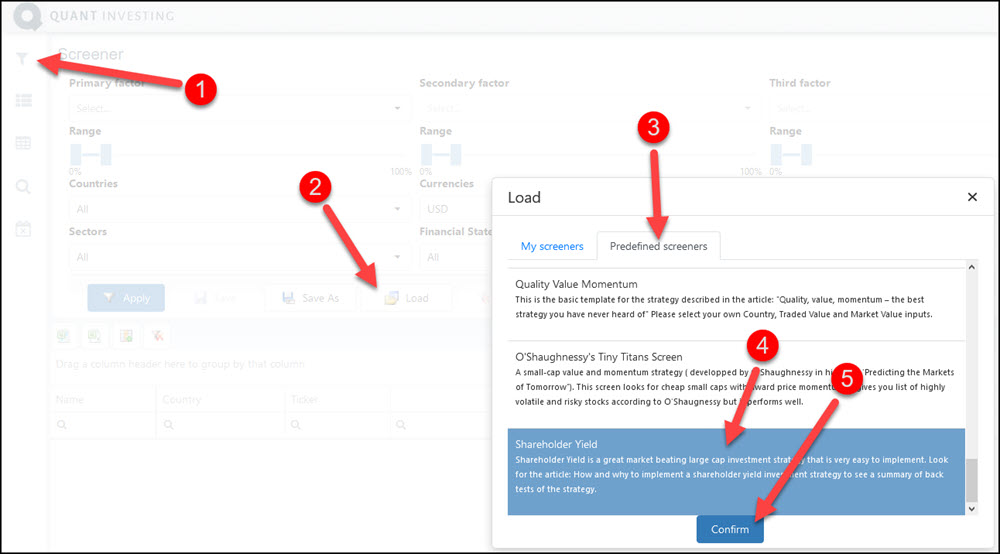
Click image to enlarge
Change it to exactly meet your needs
You can of course change the above screen to exactly meet your needs.
For example you can:
- Choose only the countries where you invest
- Choose only the industry sectors you want to see
- Change the minimum daily traded value
- Change the minimum company market value
- Back test your strategy, using the exact screen you set up
- Research any company that comes up in your screen
- Choose only the output columns you want to see
- Get email updates as soon as a new company fits the your screen
Remember to save your screen after making all the changes. Use the Save As button.
The Shareholder Yield Letter does all the work for you! - Click here for more info
Add shareholder yield yourself
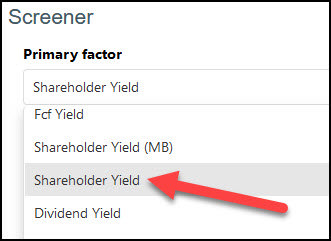
You can of course add Shareholder Yield to your investment strategy by simply selecting Shareholder Yield as one of your filters from the drop down list.
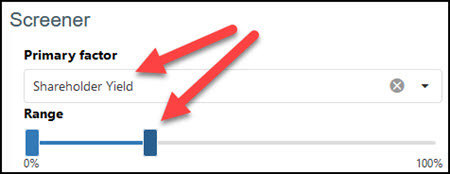
Then use the slider to select the highest Shareholder Yield companies, the highest 30% (0% to 30%) is selected in the image below.
You can also use Shareholder Yield (MB) which is Mebane Faber’s definition of Shareholder Yield and includes debt repayments.
Get the exact definition
To see exactly how all the ratios and indicators are calculated and how to use them click the following link glossary.
PS To get the Shareholder Yield investment strategy working in your portfolio sign up here
PPS It is so easy to get distracted, why not sigh up right away before you forget
The Shareholder Yield Letter does all the work for you! - Click here for more info
