Last updated: November 2026. Stock tables as at February 2025. Next update: January 2027.
The Magic Formula is Joel Greenblatt's two-ratio stock screen. It ranks every company on earnings yield (how cheap it is) and return on capital (how good the business is), adds the two ranks, and buys the best combined scores. This page gives you the top Magic Formula stock ideas worldwide, in North America, Europe and Asia, the exact screen settings, and our backtests. In Europe, the Magic Formula plus 6-month momentum returned 13.6% a year from 2016 to 2025, against 8.3% for the market.
Please note: this is general research for a broad audience. It is not personalised investment advice. Backtest returns are group averages of many stocks, share prices can fall as well as rise, and past performance does not guarantee future results. Read our full disclaimer.
1. Earnings yield = EBIT (earnings before interest and taxes) ÷ enterprise value. Rank 1 is the cheapest company.
2. Return on capital = EBIT ÷ (net working capital + net fixed assets). Rank 1 is the company that earns the most on the money it uses.
The two ranks are added together. The lowest total is the best Magic Formula company.
- Eurozone, 2016 to 2025: the top 20% of Magic Formula stocks, sorted by 6-month price momentum (50 stocks, rebalanced yearly), returned 13.6% a year with dividends, against 8.3% for the STOXX Europe 600.
- The same strategy lost 24.5% in its worst year (2018) and beat the market in only 5 of 10 years.
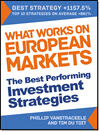
- Europe, 1999 to 2011: the best Magic Formula companies returned 182.8% over 12 years. Adding 6-month momentum lifted that to 783.3%. The market returned 30.5%.
- Of 13 ratios we combined with the Magic Formula in that study, 6-month price momentum gave the highest return.
- Our stock screener ranks 22,000+ companies worldwide on the Magic Formula, with the screen saved and ready to load.
What the Magic Formula is, in plain English
Think of it as a list for good businesses on sale.
Earnings yield tells you how cheap a company is compared with what it earns. Return on capital tells you how much profit the business makes on the money tied up in it. A company that scores well on both is a good business at a low price. That's the whole idea.
Joel Greenblatt explained it in The Little Book That Beats the Market (2005), updated in 2010 as The Little Book That Still Beats the Market. It's the book that got me started with quantitative investing in 2006.
If you want the full background, read our complete guide to Magic Formula investing.
What the research shows
I started this website because I wanted Magic Formula ideas in Europe. Greenblatt had tested the formula on US stocks. I couldn't find a proper test for Europe, so I ran one myself.
Europe, 1999 to 2011: the original test
We tested the Magic Formula on about 1,500 companies in the 17 Eurozone countries from 13 June 1999 to 13 June 2011. We left out banks, insurers, investment funds and REITs (real estate investment trusts), and companies trading less than €10,000 a day. Bankrupt companies stayed in the test, so there is no survivor bias.
The best Magic Formula companies returned 182.8% over the 12 years. The market returned 30.5%.
Then we combined the Magic Formula with 13 other ratios. The best combination was 6-month price momentum: buying the best Magic Formula companies whose share prices had risen the most in the past six months returned 783.3% over the same 12 years.
One limit: that study published total returns only. It has no worst-year or drawdown figure, which is why we re-ran the test with yearly results (below).
Eurozone, 2016 to 2025: the yearly update
This is the backtest we update every year. The rules:
- 17 Eurozone countries, no banks, insurers, investment funds or REITs, minimum €10,000 traded a day.
- Take the top 20% of companies by Magic Formula rank.
- Sort them by Price Index 6 months (share price today ÷ share price 6 months ago).
- Buy the top 50 in equal amounts on the first trading day of the year. Hold for 12 months, then rebalance.
| Year | Strategy | STOXX Europe 600 | Strategy minus market |
|---|---|---|---|
| 2016 | +25.9% | +5.5% | +20.4% |
| 2017 | +26.2% | +9.2% | +17.0% |
| 2018 | -24.5% | -10.2% | -14.3% |
| 2019 | +23.1% | +27.5% | -4.4% |
| 2020 | +24.3% | -1.3% | +25.6% |
| 2021 | +46.4% | +25.0% | +21.4% |
| 2022 | -14.0% | -8.4% | -5.6% |
| 2023 | +7.1% | +13.2% | -6.1% |
| 2024 | +7.2% | +9.7% | -2.5% |
| 2025 | +35.3% | +19.7% | +15.6% |
| Per year (2016 to 2025) | +13.6% | +8.3% | +5.3% |
Source: Quant Investing point-in-time backtest database. Total return including dividends (strategy dividends estimated from trailing yield). Returns per stock capped at +200%. Price only, the strategy returned 11.3% a year against 5.3% for the index.
Look at the losing years too. The strategy fell 24.5% in 2018 and 14.0% in 2022, and it trailed the market five years out of ten. Its edge came from the size of the winning years.
All years, rules and the companies held are on our Magic Formula backtest page.
Magic Formula alone or Magic Formula plus momentum?
In our 1999 to 2011 European test, momentum turned 182.8% into 783.3% over 12 years.
The reason is value traps. A cheap stock can stay cheap for years because something is wrong with the business. Momentum filters many of those out: if the share price has been rising for six months, other investors are already starting to see what the Magic Formula sees.
The cost is more trading. And momentum has bad years of its own (2018 above). So the tables below give you both versions.
Magic Formula stock ideas worldwide, North America, Europe and Asia (as at February 2025)
Every table below comes from the same two screens on our stock screener, run in February 2025. I update this page every January. The next lists come in January 2027.
Screen 1, Magic Formula only:
- Top 20% of Magic Formula companies
- Minimum daily trading volume of $100,000
- Minimum market value of $100 million
- Financial statements updated in the last 6 months
- Sorted by Magic Formula rank, best first
Screen 2, Magic Formula plus 6-month momentum: the same filters, but the top 10% of Magic Formula companies, sorted by Price Index 6 months, highest first.
How to read the tables: a lower Magic Formula rank is better. A Price Index 6 months of 2.60 means the share price was 2.6 times its level six months earlier (up 160%). Each idea is a starting point for 12 months of research and holding, the period the backtests use.
Worldwide Magic Formula stock ideas
All countries in the screener included.
| # | Company | Country | Magic Formula rank |
|---|---|---|---|
| 1 | DoubleDown Interactive Co., Ltd. | South Korea | 47 |
| 2 | Huuuge, Inc. | USA | 93 |
| 3 | CoinShares International Limited | Sweden | 94 |
| 4 | DoubleUGames Co., Ltd. | South Korea | 118 |
| 5 | SIGA Technologies, Inc. | USA | 137 |
| 6 | The Westaim Corporation | Canada | 150 |
| 7 | Gravity Co., Ltd. | South Korea | 151 |
| 8 | FinVolution Group | China | 153 |
| 9 | QuantaSing Group Limited | China | 163 |
| 10 | FTGroup Co., Ltd. | Japan | 197 |
| # | Company | Country | Magic Formula rank | Price Index 6 months |
|---|---|---|---|---|
| 1 | Velan Inc. | Canada | 1,726 | 2.60 |
| 2 | Bravura Solutions Limited | Australia | 1,920 | 2.23 |
| 3 | Serabi Gold plc | United Kingdom | 1,156 | 2.19 |
| 4 | Power Solutions International, Inc. | USA | 1,999 | 2.13 |
| 5 | Neto M.E Holdings Ltd | Israel | 1,926 | 2.13 |
| 6 | Techpoint, Inc. | USA | 1,767 | 2.12 |
| 7 | Rimini Street, Inc. | USA | 1,804 | 2.10 |
| 8 | JBM (Healthcare) Limited | Hong Kong | 735 | 2.07 |
| 9 | Kernel Holding S.A. | Poland | 881 | 1.99 |
| 10 | Mesabi Trust | USA | 1,750 | 1.99 |
Snapshot of the screen on our stock screener in February 2025. Prices and rankings have changed since, and some companies may have been taken over or delisted. Use them as research starting points.
See the Magic Formula stocks the screen picked a year ago
Your free demo loads the Magic Formula as a saved screen across 22,000+ European, US and Asian stocks. The demo runs on data from a year ago, so the names at the top are the companies the screen would have picked twelve months ago. Add the Price Index 6 months filter for the momentum version, then look up today's prices on any five of them.
No credit card needed. Cancels automatically after 30 days.
Magic Formula stock ideas in North America
USA and Canada. Companies here follow strict reporting rules, and if you live in North America you avoid currency risk.
| # | Company | Country | Magic Formula rank |
|---|---|---|---|
| 1 | Huuuge, Inc. | USA | 93 |
| 2 | SIGA Technologies, Inc. | USA | 137 |
| 3 | The Westaim Corporation | Canada | 150 |
| 4 | Medical Facilities Corporation | Canada | 270 |
| 5 | PROG Holdings, Inc. | USA | 322 |
| 6 | Cal-Maine Foods, Inc. | USA | 324 |
| 7 | Indivior PLC | USA | 339 |
| 8 | ADF Group Inc. | Canada | 352 |
| 9 | Dynacor Group Inc. | Canada | 384 |
| 10 | RE/MAX Holdings, Inc. | USA | 403 |
| # | Company | Country | Magic Formula rank | Price Index 6 months |
|---|---|---|---|---|
| 1 | Velan Inc. | Canada | 1,726 | 2.60 |
| 2 | Priority Technology Holdings, Inc. | USA | 2,124 | 2.53 |
| 3 | Power Solutions International, Inc. | USA | 1,999 | 2.13 |
| 4 | Techpoint, Inc. | USA | 1,767 | 2.12 |
| 5 | Rimini Street, Inc. | USA | 1,804 | 2.10 |
| 6 | Mesabi Trust | USA | 1,750 | 1.99 |
| 7 | CI Financial Corp. | Canada | 1,643 | 1.90 |
| 8 | DeFi Technologies Inc. | Canada | 2,035 | 1.86 |
| 9 | Quad/Graphics, Inc. | USA | 1,970 | 1.81 |
| 10 | Perma-Pipe International Holdings, Inc. | USA | 2,338 | 1.79 |
Snapshot of the screen on our stock screener in February 2025. Prices and rankings have changed since, and some companies may have been taken over or delisted. Use them as research starting points.
Magic Formula stock ideas in Europe
EU countries, Scandinavia and the UK. This is where Quant Investing started, and where our own Magic Formula research comes from. European companies often trade at lower valuations than similar US companies.
| # | Company | Country | Magic Formula rank |
|---|---|---|---|
| 1 | CoinShares International Limited | Sweden | 94 |
| 2 | PetroNor E&P ASA | Norway | 218 |
| 3 | Smiths News plc | United Kingdom | 236 |
| 4 | Liontrust Asset Management PLC | United Kingdom | 260 |
| 5 | Avance Gas Holding Ltd | Norway | 294 |
| 6 | Record plc | United Kingdom | 311 |
| 7 | Bure Equity AB (publ) | Sweden | 340 |
| 8 | Braemar Plc | United Kingdom | 345 |
| 9 | S.A. Fountaine Pajot | France | 353 |
| 10 | Aker BP ASA | Norway | 355 |
| # | Company | Country | Magic Formula rank | Price Index 6 months |
|---|---|---|---|---|
| 1 | Serabi Gold plc | United Kingdom | 1,156 | 2.19 |
| 2 | Kernel Holding S.A. | Poland | 881 | 1.99 |
| 3 | MT Højgaard Holding A/S | Denmark | 454 | 1.81 |
| 4 | Lubawa S.A. | Poland | 553 | 1.66 |
| 5 | VEON Ltd. | Netherlands | 1,048 | 1.65 |
| 6 | Asseco Poland S.A. | Poland | 1,288 | 1.56 |
| 7 | Intellego Technologies AB | Sweden | 1,209 | 1.52 |
| 8 | Comp S.A. | Poland | 1,596 | 1.42 |
| 9 | The Alumasc Group plc | United Kingdom | 1,394 | 1.41 |
| 10 | CoinShares International Limited | Sweden | 94 | 1.38 |
Snapshot of the screen on our stock screener in February 2025. Prices and rankings have changed since, and some companies may have been taken over or delisted. Use them as research starting points.
Lesen Sie lieber auf Deutsch? So finden Sie Magic Formula Anlageideen in Deutschland.
Magic Formula stock ideas in Asia
Australia, Hong Kong, Japan, South Korea, New Zealand and Singapore. Asian markets often move differently from Western markets, which spreads your risk. Price Index values here were published rounded to one decimal.
| # | Company | Country | Magic Formula rank |
|---|---|---|---|
| 1 | MFF Capital Investments Limited | Australia | 1 |
| 2 | DoubleDown Interactive Co., Ltd. | South Korea | 47 |
| 3 | DoubleUGames Co., Ltd. | South Korea | 118 |
| 4 | Gravity Co., Ltd. | South Korea | 151 |
| 5 | FTGroup Co., Ltd. | Japan | 197 |
| 6 | Sankyo Co., Ltd. | Japan | 204 |
| 7 | Cheryong Electric Co., Ltd. | South Korea | 209 |
| 8 | Gamecard-Joyco Holdings, Inc. | Japan | 210 |
| 9 | Mizuho Medy Co., Ltd. | Japan | 214 |
| 10 | RH PetroGas Limited | Singapore | 228 |
| # | Company | Country | Magic Formula rank | Price Index 6 months |
|---|---|---|---|---|
| 1 | JBM (Healthcare) Limited | Hong Kong | 735 | 2.1 |
| 2 | Global Link Management Inc. | Japan | 973 | 1.8 |
| 3 | Tecnos Japan Incorporated | Japan | 1,524 | 1.7 |
| 4 | Valeura Energy Inc. | Singapore | 702 | 1.6 |
| 5 | Greens Co., Ltd. | Japan | 1,601 | 1.6 |
| 6 | Kioxia Holdings Corporation | Japan | 881 | 1.6 |
| 7 | AlphaPolis Co., Ltd. | Japan | 564 | 1.5 |
| 8 | S&D Co., Ltd | South Korea | 769 | 1.5 |
| 9 | Moriya Transportation Engineering and Manufacturing Co., Ltd. | Japan | 1,699 | 1.5 |
| 10 | ID Holdings Corporation | Japan | 1,525 | 1.5 |
Snapshot of the screen on our stock screener in February 2025. Prices and rankings have changed since, and some companies may have been taken over or delisted. Use them as research starting points.
Investing in India? See how to find Magic Formula stocks in India.
How to run the Magic Formula screen yourself
The screen is saved in our screener, so it takes about a minute:
- Open the screener and click the Filter icon.
- Click Load, open the Predefined filters tab, and click Magic Formula Screen. Click Confirm.
- Under Countries, tick the countries you want.
- Enter the minimum daily trading volume and minimum market value. The numbers are in thousands, so 100 means $100,000.
- Click Apply.
For the momentum version, move the Price Index 6m slider to keep the companies whose prices rose the most over the past six months (for example the top 40%), then sort by Price Index 6m from high to low.
Run the Magic Formula by asking Claude or ChatGPT
You can also skip the clicking. Our AI connector links the screener to Claude or ChatGPT, so you type a question and get the list, or a backtest, back in the chat. It uses the same 22,000+ companies and more than 10 years of point-in-time backtest data (data as it was known on each date, so no look-ahead bias).
Questions you can ask:
“Backtest the top 20% Magic Formula stocks, sorted by 6-month momentum, in the Eurozone from 2016 to 2025. Show every year and the worst year.”
“Which companies on my watchlist rank in the top 20% of the Magic Formula today?”
The connector is part of the AI Screener and Best Deal subscriptions. ChatGPT needs a paid ChatGPT plan. Here is how to connect Claude to Quant Investing, and a worked example of backtesting a stock screen by asking Claude. To try the Magic Formula screen first, start with the free 30-day screener demo.
How to build a Magic Formula portfolio
The backtests above hold 50 stocks in equal amounts for 12 months. This is how the strategy is usually run with fewer names:
- Spread. A portfolio of 30 to 40 stocks means one bad company can't sink the result.
- Buying over time. A few stocks a month until the portfolio is full. That also spreads the entry prices.
- A 12-month holding period. Then the screen is re-run. Stocks that no longer rank in the top group are replaced by ones that do.
- Bad years. In our Eurozone test the strategy trailed the market in 5 of 10 years. A strategy only pays off if you are still using it after the bad ones.
Quick facts: the Magic Formula at a glance
- Created by: Joel Greenblatt, in The Little Book That Beats the Market (2005).
- Ranks on: earnings yield (EBIT ÷ enterprise value) plus return on capital (EBIT ÷ (net working capital + net fixed assets)).
- Best version in our tests: top 20% by Magic Formula, sorted by 6-month price momentum, 50 stocks, rebalanced yearly.
- Eurozone backtest 2016 to 2025: 13.6% a year against 8.3% for the STOXX Europe 600. Worst year -24.5% (2018). Beat the market in 5 of 10 years.
- European study 1999 to 2011: 783.3% with momentum, 182.8% Magic Formula alone, 30.5% for the market, over 12 years.
- Stock tables on this page: as at February 2025, updated every January.
- Try the screen: Quant Investing free 30-day screener demo, 22,000+ companies, no credit card needed.
- Use it from Claude or ChatGPT: Quant Investing AI connector setup.
Forward-test the Magic Formula yourself in five minutes
The demo gives you the same Magic Formula ranking these backtests used, on data from a year ago. Pick your region, add Price Index 6 months for the momentum version, and note the names at the top: the stocks the strategy would have picked twelve months ago. Look up today's prices on any five of them and you have run a real one-year forward test, no backtest software needed.
No credit card needed. Cancels automatically after 30 days.
Already convinced? Skip the demo and subscribe direct. 100% money-back guarantee for the first 30 days. See subscription options →
Frequently asked questions
What is the Magic Formula?
A stock ranking by Joel Greenblatt. It ranks companies on earnings yield (EBIT ÷ enterprise value) and return on capital (EBIT ÷ (net working capital + net fixed assets)), adds the two ranks, and treats the lowest total as the best. It finds good businesses trading at low prices.
Does the Magic Formula still work?
In our Eurozone backtest, the Magic Formula plus 6-month momentum returned 13.6% a year from 2016 to 2025, against 8.3% for the STOXX Europe 600. The ride was rough: it lost 24.5% in 2018 and 14.0% in 2022, and beat the market in only 5 of the 10 years.
Does adding momentum improve the Magic Formula?
In our 1999 to 2011 European study, yes. The best Magic Formula companies returned 182.8% over 12 years. Adding 6-month price momentum lifted that to 783.3%, the best of the 13 ratios we tested. The market returned 30.5%.
How many Magic Formula stocks should a portfolio hold?
Our backtests hold 50 stocks in equal amounts. Many private investors use 30 to 40, bought a few at a time, so no single company decides the result.
How often do you rebalance a Magic Formula portfolio?
Once a year in our backtests: hold each stock for 12 months, re-run the screen, and replace the stocks that no longer rank in the top group.
Are the stocks on this page a buy today?
The tables show what the screen found in February 2025. Prices, financial results and rankings have moved since, so treat them as research starting points. To see what ranks today, run the screen yourself. This page is general research and is not personalised investment advice.
Does the Magic Formula work outside the US?
Our European tests say it does: 182.8% over 12 years for the best Magic Formula companies from 1999 to 2011, against 30.5% for the market. A 2013 master's thesis by Topias Kukkasniemi (Lappeenranta University of Technology) found it also beat the market in Finland from 1997 to 2010. Our screener covers 22,000+ companies, so you can run it country by country.
Can I ask an AI assistant to run the Magic Formula for me?
Yes. With the Quant Investing AI connector you can ask Claude or ChatGPT to run the Magic Formula screen, add momentum, or backtest it, and get the results in the chat. The connector comes with the AI Screener and Best Deal subscriptions. The free 30-day demo lets you try the saved Magic Formula screen first.
Not personalised advice. This article is general research for a broad audience. Nothing on this page tells you what to do with your own money. Backtest returns are averages of many stocks over stated periods, the value of shares can fall as well as rise, you can lose money, and past performance does not guarantee future results. Read our full disclaimer.
Disclosure: the author does not hold any of the companies in the tables on this page.
Please note: This website is not associated with Joel Greenblatt and MagicFormulaInvesting.com in any way. Neither Mr Greenblatt nor MagicFormulaInvesting.com has endorsed this website's investment advice, strategy, or products. Investment recommendations on this website are not chosen by Mr. Greenblatt, nor are they based on Mr Greenblatt's proprietary investment model, and are not chosen by MagicFormulaInvesting.com. Magic Formula® is a registered trademark of MagicFormulaInvesting.com, which has no connection to this website.