

If you read the article, How and why to implement a shareholder yield investment strategy, where we looked at six back tests (some going back 80 years) of the Shareholder Yield we are sure you will agree that it great investment strategy.
We wanted to find out just how well the strategy worked recently so in this article we back tested the Shareholder Yield investment strategy on the Market Leaders investment universe over the six-year period from 2016 to 2022.
Before we get to the back test first a bit of background information.
Why Shareholder Yield is a great investment strategy
In one back test in the article mentioned above Jim O'Shaughnessy back tested shareholder yield over 80-years (1927–2009) and found that:
- Over all 961 (777+184) rolling 3-year periods, the top 10% Shareholder Yield companies beat other large stocks 81% of the time by an average 3.24% per year.
- If you extend the test to all 877 (855+22) rolling 10-year periods, you would have beaten the market 97% of the time by 3.41% per year.
That is an outstanding result!
In the article Jim wrote:
“In the stock market, I believe the surest way forward is to look at the long-term results for an investment strategy and how often — and by what magnitude — it beat its underlying benchmark.”
The following table shows you the results of simply buying the 10% of large stocks with the highest Shareholder Yield (dividend yield plus net stock buybacks) over an 80-year back test period:
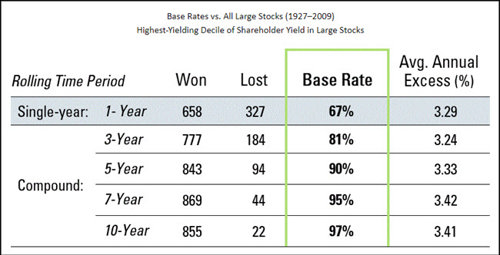
Source: 7 Traits for Investing Greatness
Click here to start using Shareholder Yield in your portfolio NOW!
Why Market leaders is a great group of companies
In this back test we used the Market Leaders investment universe.
The Market Leaders investment universe come from the book What Works On Wall Street where James O'Shaughnessy tested an investment strategy of only investing in market leading companies which resulted in market beating performance.
James defined Market Leaders as non-utility companies with larger than average:
- Market value
- Number of shares outstanding
- Free Cash flow and
- Sales above 1.5 times the average of the universe
James used US and foreign companies listed in the USA, when he tested his strategy.
But for this backtest we used Quant Investing stock screener’s database of market leader companies in all developed markets worldwide
Outstanding performance +889.3%
Back tests we have done were VERY encouraging.
If you, over the 14-year period from 2000 to 2014, bought the 20 most undervalued Market Leaders worldwide you would have earned a compound yearly return of 18.5% (889.3% over 14 years) compared to only 8.3% per year (105.3% over 14 years) that the index returned over the same 14-year period.
And remember these were large companies, we are not talking about the small company effect here.
These are companies with a market value over €1 billion, that are available to trade at all brokers, and easy to buy and sell.
What Investment strategy was tested?
In this back test over the six-year period from December 2015 to May 2022 we tested, the Shareholder Yield investment strategy applied to the Market Leaders investment universe.
How were the ratios calculated?
To make sure we are on the same page, Shareholder Yield was calculated as follows:
Shareholder yield is the sum of: Dividend yield + Percentage of Shares Repurchased
For example, if a company trading at €50 and pays an annual dividend of €1, its dividend yield (DY) is 2%.
If same company had 1,000,000 shares outstanding at beginning of year and 900,000 at end of year, the company's share buyback yield would be 10% ((1,000,000 – 900,000)/1,000,000).
If you add the two percentages together you get its Shareholder yield of 12%.
Market Leaders is a group of large companies on steroids. They are non-utility companies extracted from the Quant Investing stock screener’s database of more than 22,000 companies with larger than average:
- Market value
- Number of shares outstanding
- Free Cash flow and
- Sales above 1.5 times the average of the universe
In the calculation of all the averages, companies with a market value of less than €50 million were excluded.
Exactly what did we back test
This is what the back test screen looked like:
- Market Leaders companies worldwide
- All developed countries included
- All industry sectors included
- Sort the result by Shareholder Yield from high to low
- Buy the top 25 companies
Click here to start using Shareholder Yield in your portfolio NOW!
How and when were portfolios formed?
Portfolios were formed on the seventh of December and sold again on the seventh of December one year later if it was a trading day. If not, the previous trading day was used.
In 2022 the last portfolio was sold on 5 May 2022.
Portfolios were formed by taking the 25 companies with the highest Shareholder Yield on each rebalancing date.
Costs, fees, and taxes not included
We did not include any trading fees or taxes in the back test.
Dividends included 6% per year!
Dividends were included in the return calculation as they made up a BIG part of the strategy’s return.
Over the 6-year back test period the average yearly dividend return was 6% and varied from 4.7% to 7.1%.
What was not included
Currency movements were not included. We simply averaged the price returns plus the average dividend yield of all the companies on each rebalancing date to get the average return of the portfolio.
Who and why was this back test done?
We did the back test using the Quant Investing stock screener’s point in time database . You can read more about how you can back test your own investment strategy here: How to do your own back tests.
We back tested the strategy to see how a great investment strategy performed the past few years.
We do not have a conflict of interest we just want to help our own returns and help you improve your returns .
How we address biases in the back test
Look-ahead bias
Look-ahead bias happens when the data the back test is based on could not have been known or available during the back test period.
For example, if you formed portfolios on 31 December each year using the company’s 31 December financial information. This is not possible because the company’s 31 December financial information is only released three to five months after 31 December.
As the point-in-time back test database comes from saving all the data in the stock screener every day, look ahead bias is excluded. This is because the data on the days the portfolios were formed uses the exact data in the screener as it was on that day in the past.
No adjustments are made to the saved data after is saved.
Survivorship bias
Survivorship bias can lead to better back test returns because companies that went bankrupt were ignored (not in the back test universe) when the back test portfolios were formed.
This bias is excluded as all the companies in the screener is saved each day which is used to build the back test database.
Should a company have gone bankrupt or be delisted the database saved the last price the company’s stock traded at. So, all companies are included in the database, not only companies that survived.
Over-fitting bias
Overfitting bias can take place if the back test is done using ONLY a period when the investment strategy worked very well. This means if you tested the strategy in another period, it would not work as well at all.
We did not select a specific period to test the strategy we used ALL the historical data available.
So, does the strategy work?
Now for the most important part did the strategy work.
Yes, it worked great!
As you can see below, it performed a LOT better than the market on average and on a compound average growth rate basis!
The standard deviation (volatility) of returns of the strategy was also lower than the market. This was because of the high average 6% dividend yield of the strategy.
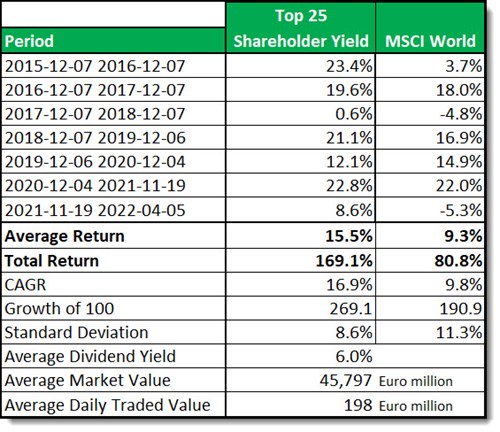
Source: Historical screener at www.quant-investing.com
Comments on the above table
No negative years
As you can see the strategy had no negative years whereas the index had two.
High dividend yield of 6%
The average dividend yield of the strategy 6%, so it is also an incredibly good income strategy, for your retirement.
Average market value €45.8 billion or $50 billion
The average company size is massive, over €45 billion ($50 billion). This makes the companies extremely easy to buy also with your current broker and your tax-free account.
Average traded value €200 million or $210 million
The daily traded value is also huge, over $200m per day. This means easy, fast order execution with a low bid-offer spread. No more limit adjustments as the price runs away or expensive orders executed over days.
Click here to start using Shareholder Yield in your portfolio NOW!
Easy to implement large company strategy
You can also see it is an easy strategy to implement as all investments were large companies with an average market value of over €45 billion and an average daily traded value of over €190 million
Here are all the countries included in the back test portfolios over the six-year period.

Source: Historical screener at www.quant-investing.com
Summary and conclusion
So, as a lot of other back tests have confirmed, Shareholder Yield is a great investment strategy that over the past six years (when value performed terribly) also beat the market.
Apart from this the Shareholder Yield investment strategy:
- Gives you great market beating returns – Average and CAGR returns
- Is easy to implement – Large cap companies
- Is easy to buy – Very liquid companies
- Has lower volatility than the market
- Pays a high dividend – 6% on average
Click here to start using Shareholder Yield in your portfolio NOW!
How you can implement a Market Leader Shareholder Yield investment strategy in your portfolio
The Quant Investing stock screener makes it easy to implement the strategy in your portfolio.
How to set up your screen
After logging in this is how you set up your stock screen.
Select Market Leaders as Primary Factor and set the sliders from 0% to 100% to select all Market Leaders companies.
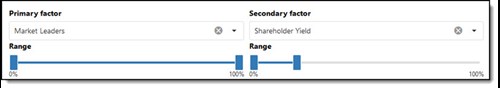
Then do the following:
- Select all the countries you want to include. We included China in the back test, you may choose to leave it out.
- Select the industry sectors you would like to include. All sectors were included in the back test.
- In the back test we did not include a minimum daily trade value as the Market Leaders universe already has only large cap companies
- We also did not include a minimum market value as the Market Leaders universe already has only large cap companies
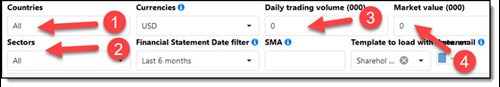
Then click the Apply button to run your screen.
Add Shareholder yield as output column
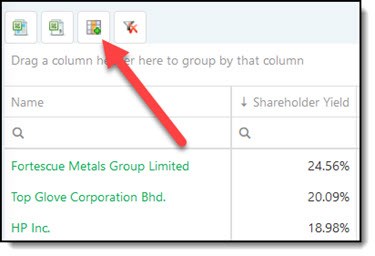
To add Shareholder Yield as an output column, click the Add/Remove Columns icon.
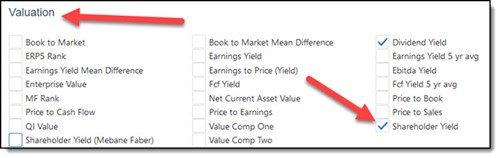
Then click the Valuation tab and tick the box next to Shareholder Yield. The same way you can select all the columns you would like to see.
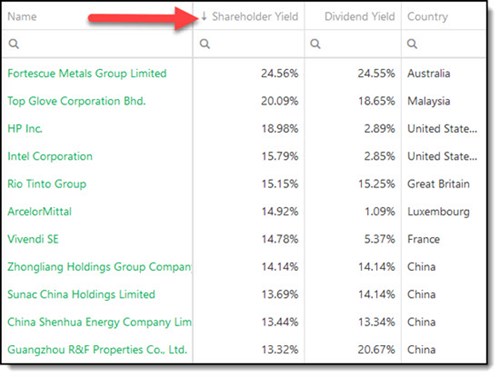
Sort by Shareholder Yield
Click the Shareholder Yield column heading twice to sort it from high to low.
Buy the top 25 companies
In this back test we bought the top 25 Shareholder Yield companies each year.
PS To get the Shareholder Yield investment strategy working in your portfolio today sign up right here .
PPS It is so easy to put things off and forget so why not sign up right now .
Click here to start using Shareholder Yield in your portfolio NOW!
