

The Quant Investing stock screener also lets you to back test your investment strategy using point in time data. It allows you to look into the past (using the exact historical company and market data) and see exactly what stocks your strategy would have selected and what the returns would have been.
This article shows you exactly how to do back tests with a real world example.
Make sure you download the spread sheet
Important - You can download a spread sheet that shows you all of the back test data and calculations – it’s at the bottom of the article. 👇
Back test of the Magic Formula + Momentum investment strategy
This article shows you a back test of the Magic Formula combined with momentum (Price Index 6 months) investment strategy in Europe over the four year period from January 2016 to December 2019.
It is a further back testing of this investment strategy: Magic Formula investing & Price Index 6m momentum investment strategy
If you have not used the stock screener before this article shows you exactly how to get stated: Quant Investing Screener Quick Start Guide
Back test data is available from 4 December 2015.
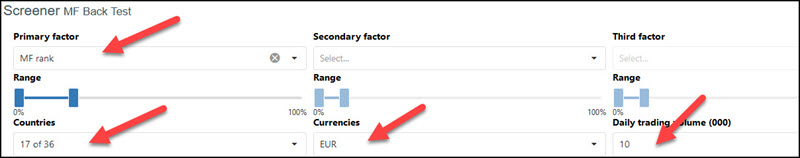
Exact Back Test Screener Settings
Here are the details of the back tested investment strategy:
- Countries - 17 Eurozone countries (Austria, Belgium, Cyprus, Estonia, Finland, France, Germany, Greece, Ireland, Italy, Luxembourg, Malta, the Netherlands, Portugal, Slovakia, Slovenia, and Spain)
- Exclude banks, insurance companies, investment funds, certain holdings companies, and REITS
- Exclude companies with an average 30-day trading volume of less than €10,000
- Portfolios formed on the first trading day of the year (Because the back test database is point in time there is not risk of look-ahead bias)
- Returns were compounded on an annual basis
- First select the 20% best ranked Magic Formula companies
- Secondly sort the list by Price Index 6 months from high to low
- Buy the top 50 companies by Price Index 6 months on an equal weight basis
- Rebalance after one year
Click here to start back testing your investment strategy NOW!
This is what the screen looks like.
How to Screen the Past - Backtesting
This is how you set up a back test.
I expand on all the points below but here are the steps if you know the screener:
- Login and go to the screener
- Set up or load a screen
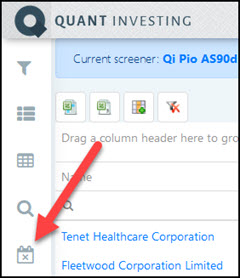
- Click on the Historical Screener icon
- Select the date in the past from where you want the screener results for
- Select the future closing price date to where you want to calculate returns
- Click Confirm to get the historical screener results
Detailed Back Test Steps
Here are the detailed steps to back test your strategy.
1. Login and Set up or load a saved screen
For instructions on exactly how to log in and set up a screen look at this article: How to run your first screen with the Quant Investing screener
2. Get historical results of your screen
Set up the stock screen you want to back test so you have a list of companies that currently fit your screening criteria. You are now ready to go back in time.
To do this click on the Historical Screener icon to open the Historical Screener date selector.
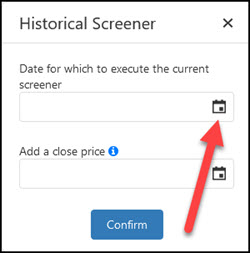
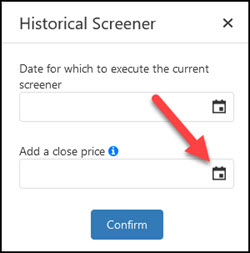
A window will the open where you can select two dates.
The first date is the date in the past you want to the screener to run and give you investment ideas. The closing stock prices on this date will automatically be added.
You can also (you do not have to) select a second closing price date.
Adding a second date
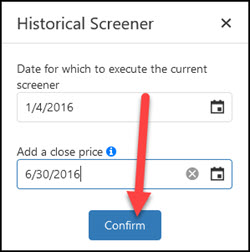
If you add a second date the Screener will automatically calculate the stock price percentage change from the first date to the second closing price date.
For example , if you choose to run the historical screener on 3 January 2024 and enter 30 June 2024 as the second date the screener will automatically calculate the stock price return from 3 January 2016 to 30 June 2016 for you.
This makes it easy to see how your investment strategy has performed.
To select the past date you would like to screen for click the top date selector icon.
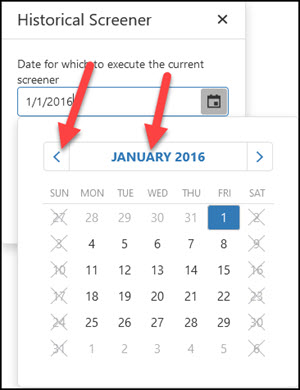
To select a date you can either click the blue left arrow or click on the date heading as shown below.
Next select a second closing date.
The Historical Screener will calculate returns from the above selected screener date to this date.
After selecting the date click the Confirm button to start the historical screen.
That is all you have to do to back test or screen stocks to get past results.
Click here to start back testing your investment strategy NOW!
If there is "No Data"
As you saw you can only select weekdays. However it happen that the day you selected was a market holiday (this happens a lot around year end) with no stock prices.
If it was a market holiday you will see a "No data" message like this:
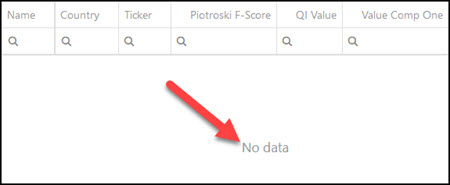
If you get the No data message simply select a weekday before or after the date you selected until you get a result. The day you selected was most likely a market holiday. This happens a lot around year end.
What were the returns of your back test?
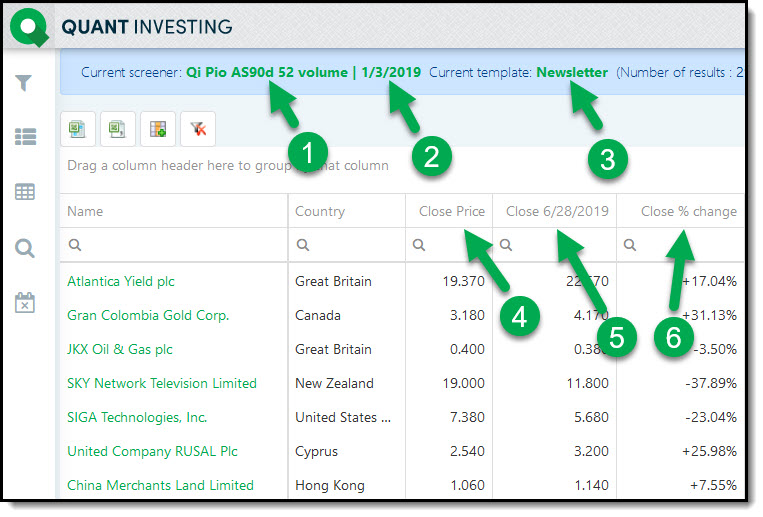
The results of your back test will look like this (number explanation below):
Click image to enlarge
- Shows you what saved screen you are back testing
- Shows you the date you are back testing (companies that fit your screen on that date)
- Shows you the saved Template you are using. A Template is a saved collection of columns displayed with a screen.
- The closing price on the date you are back testing. The date shown in 2.
- The second closing price date you selected.
- The percentage change from the closing price in 2 to the closing price in 5.
If the returns look unusual
We have done a lot of work to make sure the data is reliable. But as you can imagine with more than 22,000 companies over so many years something can go wrong.
So. if the returns of companies in your back rest look unusual, -100% or no return for example. Please check to see it that is correct.
Export to Excel for more calculations
If you want to calculate more return numbers remember you can export the above results to Microsoft Excel (download the spreadsheet template below to help you).
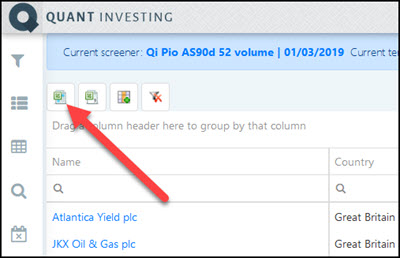
To export to Excel just click on the Export Data to MS Excel icon.
Click here to start back testing your investment strategy NOW!
Getting back the Magic Formula investment strategy back test
Getting back to how the Magic Formula Momentum investment strategy performed.
Here are the summarised results:
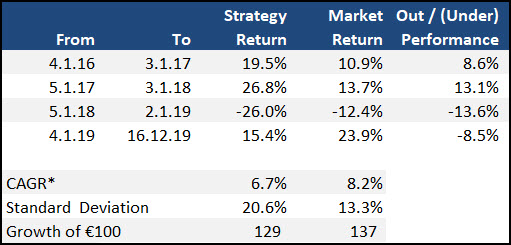
You can see the strategy performed well in 2016 and 2017 but did not beat the market (EURO STOXX® Index) on a CAGR basis.
This was mainly because of the 2018 loss of 26%.
Here is your back test spreadsheet - Free Download
Click on the link below to download the spread sheet with the Magic Formula Europe investment strategy back test:
Magic Formula Europe Back Test Spreadsheet
That is how easy it is for you to back test your investment strategy.
PS Not a subscriber to the Quant Investing stock screener and back tester yet? Sign up here.
PPS Why not sign up right now before it slips your mind?
Click here to start back testing your investment strategy NOW!
Frequently Asked Questions About Back Testing Your Investment Strategy
What is back testing, and why is it important for my investment strategy?
Back testing is the process of evaluating an investment strategy using historical data to see how it would have performed in the past, in all market conditions. It helps you understand the effectiveness of a strategy before you commit real money. It allows you to refine and improve your approach based on actual past market performance.
How do I set up a back test in the Quant Investing stock screener?
To set up a back test:
- Log in to the Quant Investing screener.
- Load or create your desired screen.
- Click on the Historical Screener icon.
- Select the start date for your back test.
- Optionally, select an end date to calculate returns over a specific period.
- Click Confirm to see the historical screener results.
What data can I use for back testing my strategy?
The Quant Investing stock screener uses point-in-time data, ensuring that there is no look-ahead bias. You can select historical dates to see which companies met your screening criteria at that time and calculate their subsequent performance.
What settings should I use for a back test of the Magic Formula Momentum strategy?
For the Magic Formula Momentum strategy, use the following settings:
- Countries: Select the countries you want to test.
- Exclude banks, insurance companies, investment funds, certain holdings companies, and REITs.
- Exclude companies with an average 30-day trading volume of less than €100,000.
- Select the top 20% Magic Formula companies and sort by 6-month Price Index, buying the top 50.
- Form portfolios on the first trading day of the year.
- Rebalance annually.
How do I interpret the results of my back test?
After running the back test, the results will show the companies that fit your criteria on the selected dates, along with their closing prices and the percentage change over the period you selected. This lets you to find out how well your strategy would have performed. Look for consistent returns and avoid strategies with high volatility or frequent large losses.
What should I do if my back test results show "No Data"?
If you see a "No Data" message, it means the selected date was a market holiday or there was no trading data available. Simply choose a weekday before or after the selected date until you get valid data.
Can I export my back test results for further analysis?
Yes, you can export your back test results to Excel for more detailed analysis. Click on the "Export Data to MS Excel" icon in the screener, and you can perform additional calculations or create custom reports to further evaluate your strategy's performance.
Click here to start back testing your investment strategy NOW!
