Last updated: October 2026. Both backtests were run on 16 October 2026.
The short answer
You can backtest a stock screener by asking Claude or ChatGPT one question in plain English. I saved two screens on Quant Investing, the Magic Formula and the Magic Formula with a 12-month momentum filter, and asked Claude and ChatGPT to test both from January 2016 (more than 10 years). The plain version returned 0.95% a year. With momentum it returned 4.41% a year. The screen's own universe returned 9.87% a year. Each test took one to two minutes.
Backtest, definition: a backtest applies a stock-selection rule to past data and measures what the chosen stocks returned over a fixed holding period. Formula: return = (exit price + dividends - entry price) / entry price. It is hypothetical.
Key findings from the test
- Plain Magic Formula: +9.88% in total over 10 years, a compound annual growth rate (CAGR) of 0.95%. The screen's own universe: +156.23%, a CAGR of 9.87%.
- Adding a 12-month momentum filter: +53.98% in total (CAGR 4.41%). Momentum beat the plain version in 8 of the 10 yearly periods.
- Each screen beat the universe in only 2 of the 10 periods, the ones starting on 31 December 2021 and 31 December 2024.
- Worst peak-to-trough fall: -52.53% (plain) and -53.73% (momentum), against -24.74% for the universe, all in March 2020.
- Setup: 38 countries, market value of at least €100m, 30 stocks held for 12 months, dividends included, trading costs not included.
The old way: hours between your data and your decision
The old way of backtesting starts with an export. You pull a stock list from your screener, export prices, and paste both into a spreadsheet. Then you match tickers, adjust for splits, add dividends, rebuild the list for every year and average the returns.
It takes hours, and one wrong column spoils the result.
That is the work between your data and your decision. Most investors stop there, so they never learn how an idea behaved in 2018 or 2022.
The new way is one question. You save the screen once on the website, then ask Claude or ChatGPT to backtest it. It applies your rules to the data of each past start date, takes the top 30 stocks, holds them for 12 months and reports the result.
Joel Greenblatt described the Magic Formula in 2005 in The Little Book That Beats the Market: rank stocks by earnings yield and return on capital. Narasimhan Jegadeesh and Sheridan Titman (1993) found that stocks that rose over the previous 3 to 12 months kept outperforming over the next 3 to 12 months. I tested the first idea alone, then with a 12-month momentum filter.
Our Magic Formula and momentum study covers the same idea over an earlier period.
Step 1: Save the screen once on the website (90 seconds)
Log in to Quant Investing, open the screener and set your rules. Save the screen under a name you will remember. Claude or ChatGPT cannot create a screen, so this step happens on the website and takes about 90 seconds. My two screens differ in one filter:
| Setting | Screen A | Screen B |
|---|---|---|
| Saved name | MF Backtest Global | MF + Momentum Backtest Global V2 |
| Countries | 38 countries | 38 countries |
| Sectors excluded | Financials, Real Estate, Utilities | Financials, Real Estate, Utilities |
| Market value | At least €100m | At least €100m |
| Daily traded value | At least €125k | At least €125k |
| Magic Formula rank | Best 20% | Best 20% |
| 12-month price momentum, excluding the last month | Not used | Top 30% |
| Sort order | Magic Formula rank, best first | Magic Formula rank, best first |
Step 2: Ask the question
Open Claude or ChatGPT with the APT or MCP connector connected (how to connect Claude to Quant Investing). Then type this:
Type this into Claude or chatGPT
Back-test my saved screens "MF Backtest Global" and "MF + Momentum Backtest Global V2" from 4 January 2016. Hold the top 30 stocks for 12 months, sort by Magic Formula rank, best first, and compare both with the screen's own universe. Show annual return, total return, worst fall, best and worst year, and how many years each screen beat the universe.
A fresh calculation took about 1 minute for the plain screen and 2 minutes for the momentum screen. A repeat of the same question came back in about 1 second.
The results: Magic Formula against Magic Formula plus momentum
Both screens next to the screen's own universe, which is every stock that passes the screen's filters, held with equal weight.
| Measure | Magic Formula | Magic Formula + momentum | Screen's universe |
|---|---|---|---|
| Total return over 10 years | +9.88% | +53.98% | +156.23% |
| Annual return (CAGR) | 0.95% | 4.41% | 9.87% |
| Worst peak-to-trough fall | -52.53% | -53.73% | -24.74% |
| Best 12-month period | +30.04% | +39.04% | +26.33% |
| Worst 12-month period | -22.08% | -17.51% | -13.94% |
| Periods with a positive return | 5 of 10 | 6 of 10 | 8 of 10 |
| Periods that beat the universe | 2 of 10 | 2 of 10 | n/a |
| Picks with a price (of 300) | 299 | 299 | n/a |
Source: Quant Investing screener through the Claude connector (backtest tool), run on 16 October 2026. 30 stocks, equal weight, 12-month hold, dividends included, trading costs not included. The universe is the screen's own equal-weight basket, not an MSCI or S&P index.
General research, not personalised advice. The test is hypothetical, trading costs are not included and past results do not predict future results.
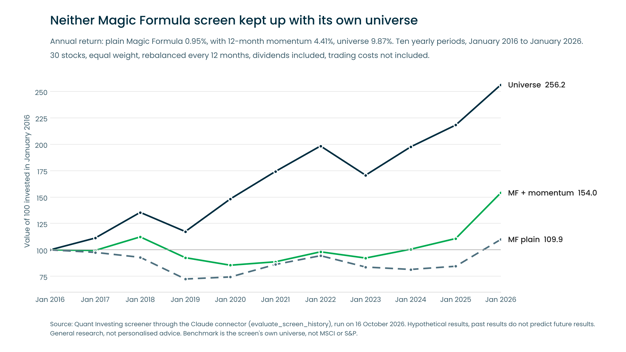
plus momentum to 154.0 and the plain Magic Formula to 109.9 by January 2026.
| Start date | End date | Magic Formula | Magic Formula + momentum | Screen's universe |
|---|---|---|---|---|
| 2016-01-04 | 2017-01-03 | -2.36% | -0.55% | +11.19% |
| 2017-01-03 | 2018-01-03 | -4.80% | +12.91% | +21.85% |
| 2018-01-03 | 2019-01-03 | -22.08% | -17.51% | -13.40% |
| 2019-01-03 | 2020-01-03 | +2.66% | -7.72% | +26.33% |
| 2020-01-03 | 2021-01-02 | +15.89% | +3.79% | +17.54% |
| 2020-12-31 | 2022-01-02 | +9.67% | +10.65% | +13.84% |
| 2021-12-31 | 2023-01-02 | -11.37% | -6.01% | -13.94% |
| 2022-12-30 | 2024-01-02 | -2.72% | +9.05% | +15.70% |
| 2024-01-02 | 2025-01-01 | +3.70% | +10.07% | +10.47% |
| 2024-12-31 | 2026-01-01 | +30.04% | +39.04% | +17.45% |
Source: Quant Investing screener through the Claude connector (backtest tool), run on 16 October 2026. Returns include dividends and exclude trading costs.
Magic Formula vs Magic Formula plus momentum. Momentum beat the plain version in 8 of the 10 periods and lifted the annual return from 0.95% to 4.41%. The fall in March 2020 was about the same size for both (-52.53% and -53.73%).
Screen vs universe. Neither screen beat the universe (9.87% a year). Each beat it in 2 of the 10 periods: the one starting on 31 December 2021, when the universe fell 13.94%, and the one starting on 31 December 2024.
Why this differs from the 20-year Magic Formula backtest. That page tests 6-month momentum on 50 stocks in 17 Eurozone countries and reports +13.6% a year with dividends for 2016 to 2025 against +8.3% for the STOXX Europe 600. My test uses 38 countries, 12-month momentum, 30 stocks and the screen's own universe, so the two results measure different things. Small changes in settings move the answer a lot, so test your own version.
Backtest your own screen in about two minutes
Save any screen, then ask Claude or ChatGPT to test it against its own universe. The connector comes with the Best Deal plan, together with the Screener, Quant Value and the Shareholder Yield Letter.
Backtest your own screen with Claude
100% money-back guarantee for the first 30 days.
What a backtest cannot tell you
Read the table with these limits in mind.
- Hypothetical. The tool applies today's screen rules to the data of each past date. Past results do not predict future results.
- Ten years. The earliest start date is 1 January 2016.
- Own universe. The benchmark is an equal-weight basket of every stock that passes the screen's filters, limited to the 2,500 largest by market value in each period.
- Costs. Trading costs and taxes are not included. Each stock is measured in its own trading currency.
- Survivorship. A stock that stops trading is priced at its last close. That suits a buy-out and can flatter a failure. In my runs 7 plain-screen ideas and 10 momentum ideas had price series that ended early.
- Data timing. The test can use company numbers a few weeks before an investor could have seen them (6 to 12 weeks for quarterly numbers).
- Winner cap. One stock return is capped at +200% to stop any one idea influencing the returns.
What the test found wrong in our own data
The database holds more than 22,000 companies and more than 110 indicators, with more than 10 years of history. At that size some prices and dividends are wrong, in every database from every supplier. The useful question is how fast you can find the errors.
The AI back test lists every idea with its entry price, exit price and dividends, and flags price series that end early.
For example:
| Company | Period | What the check found | Effect |
|---|---|---|---|
| PSK Inc. (South Korea) | 2019 | Entry price adjusted for a company split, exit price not. The -78.87% return is false. | Plain total 9.88% becomes 12.9% if removed |
| Palatin Technologies (US) | 2020 | Entry price dated 9 months before the start date. The -24.30% return is unreliable. | Plain total becomes 11.2% if removed |
| SNK (South Korea) | 2020 | Dividend of 3,332 won on a 17,450 won price (19%), likely a one-off payment. | Plain total becomes 9.3% without it |
| Oxurion, VirnetX, Acorda Therapeutics, FTS International, Co-Diagnostics | Various | Price level shown after later reverse splits (Oxurion at €34,950). Entry and exit share a basis, so the return is right. | None |
| Royalty trusts, funds and holding companies | 2016 to 2024 | 8 of 299 priced picks in the plain screen and 5 of 299 in the momentum screen. The screener cannot filter them out, so I removed them by hand. | Plain 1.08% a year, momentum 4.82% a year |
With the three price faults fixed and the non-operating names removed, the plain screen returns +15.4% in total (1.44% a year) and the momentum screen +60.1% (4.82% a year). The universe stays far ahead at 9.87% a year. These are my own estimates: I dropped the names and averaged the rest. The results table shows the raw numbers, and nothing I removed changes the answer.
Run the same check on your own screens with one more question:
Type this into Claude or Chatgpt
For my saved screen "MF + Momentum Backtest Global V2" on 30 December 2022, list all 30 picks with entry price, exit price, dividends and return. Flag any pick where the price series ends early or a dividend looks too large.
From backtest to ideas: the current top 10 of the momentum screen
A backtest shows how a screen behaved. The next question is what it finds today. I asked Claude and ChatGPT:
Type this into Claude / Chatgpt
Show me the current top 10 of my saved screen "MF + Momentum Backtest Global V2", sorted by Magic Formula rank, best first.
| Rank | Company | Ticker | Country | Sector | Price on 14 October 2026 |
|---|---|---|---|---|---|
| 1 | DoubleDown Interactive | NasdaqGS:DDI | South Korea | Software | USD 13.65 |
| 2 | Hunter Group | OB:HUNT | Norway | Oil equipment and services | NOK 17.78 |
| 3 | 2CRSI | ENXTPA:AL2SI | France | Computer hardware | EUR 27.74 |
| 4 | Chiyoda Corporation | TSE:6366 | Japan | Industrial machinery | JPY 629 |
| 5 | Concentra Group Holdings Parent | NYSE:CON | United States | Health care services | USD 37.46 |
| 6 | New Murchison Gold | ASX:NMG | Australia | General mining | AUD 0.061 |
| 7 | Ironwood Pharmaceuticals | NasdaqGS:IRWD | United States | Pharmaceuticals | USD 3.60 |
| 8 | West African Resources | ASX:WAF | Australia | Gold mining | AUD 3.60 |
| 9 | Sun Pharma Advanced Research Company | NSEI:SPARC | India | Pharmaceuticals | INR 191.81 |
| 10 | Alphamin Resources | TSXV:AFM | Mauritius | Mining | CAD 1.42 |
Source: Quant Investing screener, saved screen ranked by Magic Formula rank. Data as at 14 October 2026 (October 2026). Prices are in each stock's trading currency.
This is the output of a screen, ranked by the Magic Formula. It is general research, not personalised advice and not a recommendation to buy or sell. Several companies are small and thinly traded, prices fluctuate and you can lose capital. We judge ideas over a 12-month holding period.
Try it yourself: 3 prompts to copy
A backtest variant
Same screen, 6-month holding period.
Type this into Claude / chatgpt
Back-test my saved screen "MF + Momentum Backtest Global V2" from 4 January 2016, but hold each batch of 30 stocks for 6 months. Compare it with the screen's own universe and show me the worst fall.
A Europe-only list
A current list, not a backtest. A backtest follows the countries saved in the screen, so save a Europe-only screen for that.
Type this into Claude / chatgpt
Show me the top 20 European stocks ranked by Magic Formula. Use the universe sp350_europe, sort by Magic Formula rank with the best first, and show the country and sector for each.
Explain the top 3
Plain-English explanations and risks to check.
Type this into Claude / chatgpt
Take the top 3 stocks from my saved screen "MF + Momentum Backtest Global V2". For each one, explain in plain English what the company does, why it ranks high on the Magic Formula, and which risks I should check. Do not give a buy or sell opinion.
More prompts: Quant Investing MCP command library. For a routine, see my weekly portfolio review with Claude.
What you need
You need the Best Deal plan: €79.70 a month, or €779.70 a year (€64.98 a month). It includes the Screener, Quant Value, the Shareholder Yield Letter and the Claude / ChatGPT connector. The Pro Screener plan at €45.70 a month does not include the connector. Cancel in any month. Setup takes about 15 minutes, once. Nothing is installed on your computer, and you can remove the connector in about 30 seconds.
Test your own screening rules against 10 years of data
You have seen the question, the answer and the faults in the data. The Best Deal plan gives you the connector, the Screener and both newsletters for €79.70 a month. Save a screen, ask Claude or ChatGPT to test it, and read the result for yourself.
See the Best Deal plan and the Claude connector
100% money-back guarantee for the first 30 days.
Want to look at the screener first? Try the free demo. No credit card needed. It cancels automatically after 30 days.
General research, not personalised advice. These results cover the full 10-year record of both screens, including the losing years and the falls of -52.53% and -53.73%. Individual results vary and past performance does not guarantee future results.
Frequently asked questions
How far back can I backtest a stock screener with Claude or ChatGPT?
The earliest start date is 1 January 2016, about 10 years of history. You can hold stocks for 3, 6, 12 or 24 months and use up to 50 stocks per period. My test ran from 4 January 2016 to 1 January 2026: ten 12-month periods with 30 stocks each.
Which factors can I backtest?
About 125 primary factors work in a backtest, including the Magic Formula rank, earnings yield, return on capital and the 12-month price index excluding the last month. Nine extended factors, such as the momentum composite, work in live screens but are refused in backtests, because they would use today's values on past dates.
Can I backtest my own screen?
Yes. Save the screen on the website first (about 90 seconds), then ask Claude / ChatGPT to back-test it by name. The tool applies your rules as they are today to the data of each past start date.
What does it cost?
The Best Deal plan costs €79.70 a month, or €779.70 a year (€64.98 a month), and includes the Screener, Quant Value, the Shareholder Yield Letter and the Claude / ChatGPT connector. Pro Screener costs €45.70 a month without the connector. There is a 100% money-back guarantee for the first 30 days.
Is this investment advice?
No. It is general research that gives you ideas to review and a record of how a rule behaved. In my test neither screen beat its universe (0.95% and 4.41% a year against 9.87%), and costs are excluded. Past results do not predict future results. The decision is yours.
About the author. Tim du Toit has invested for 39 years (since 1987) and is the founder of Quant Investing. He is the author of Quantitative Value Investing in Europe: What Works for Achieving Alpha, a 12-year study (1999 to 2011) of 168 investment strategies across European markets, and writes the Quant Value newsletter, live since 2009.
General research, not personalised advice. Read the full disclaimer.