
Last updated: July 2026
Key facts:
The Quant Value newsletter has published 192 monthly issues, every month without a gap, since 19 July 2010. Sixteen full years of live recommendations across the European debt crisis, the 2015 China selloff, the Covid crash, the 2022 bear market, and three years of rate hikes. Written by Tim du Toit, 39 years of investing experience, author of Quantitative Value Investing in Europe: What Works for Achieving Alpha.
This July the Quant Value newsletter turns 16. That is 192 monthly issues, one every month without a gap, since 19 July 2010.
Sixteen years matters for a single reason: most "proven" investment strategies are proven on paper, backtested, written up, sold, and then quietly stop working when real money is on the line. Sixteen years of live publication is a different kind of proof.
Real time, real markets, real money, including ours. The rest of this article lays out what those years included, what changed, and what you inherit as a reader starting today.
A strategy that survived conditions back-tests cannot recreate
The first issue went out one and a half years after the March 2009 market low. This is what was written about the first two companies recommended:
"In spite of these very acceptable financial results the share prices have not moved up much from the lows reached in March 2009, giving you the ideal opportunity to invest."
The mood at the time was grim. Europe was in recession and the sovereign debt crisis was building. Few investors wanted European small caps. That was exactly where the cheapest companies sat.
We bought them anyway. The strategy held.
Since then the newsletter has been published every single month through:
-
The 2011–2012 European sovereign debt crisis
-
The 2015 China-driven global selloff
-
The early 2016 oil price collapse
-
The Q4 2018 correction
-
The Covid crash of March 2020
-
The 2022 bear market
-
Three years of rate hikes from 2022 onwards
No skipped issues. No "we are pausing this month because the market is too uncertain." Every month, the screen ran, the companies were vetted, the issue went out.
The rules improved as the markets taught us
A 16-year-old newsletter publishing the same strategy from 2010 would be a problem, not an achievement. Markets change. Risk management gets better with experience. The newsletter changed with it.
Three concrete additions, each from a real lesson:
- March 2015: strict 20% trailing stop loss. Sell losing investments fast. Let winners run. The full method is here: strict 20% trailing stop loss strategy.
- December 2017: no new investments in falling markets. No new recommendations if a market is trading below its 200-day simple moving average. The reason is mechanical. In falling markets, correlations spike. Everything goes down together. Buy a cheap company during the slide and the trailing stop loss triggers almost immediately. This rule prevents that. Detail: no new investments when markets are falling.
- April 2020: the Market Crash portfolio. When Covid hit and investors sold indiscriminately, the standard rules said no new buys. But high-quality companies were on sale at prices that would not return for years. So, a separate portfolio was built with stricter quality ratios, no momentum requirement, designed specifically to operate when the rest of the system is paused. Background: Quant Value Crash portfolio started.
Each rule came from real losses. Each was tested before being added. None were a hunch.
Performance and drawdowns over 16 years
The charts below show what a subscriber who followed every newsletter recommendation from inception on 1 July 2010 would have experienced through 30 June 2026, with all the risk management rules in place. Dividends are reinvested. No transaction costs, taxes, or slippage are assumed. Two currency views are shown because the newsletter recommends companies globally: a US Dollar investor and a Euro investor experienced different journeys because of currency movements over 16 years.
A US Dollar Investor
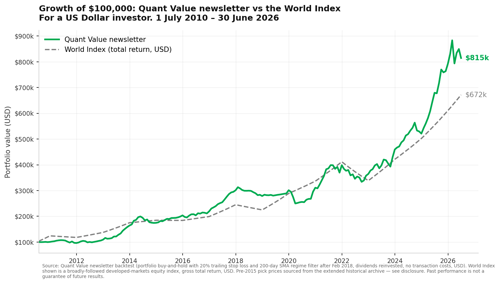
Growth of $100,000, 1 July 2010 to 30 June 2026. Total return, USD, dividends reinvested. Source: Quant Value backtest; World Index is a broadly-followed developed-markets equity benchmark, gross total return.
Over 16 years the Quant Value portfolio returned 714.7% in total, or 14.0% per year compounded, in US Dollars. A broadly-followed developed-markets World Index (gross total return, USD) returned 571.6% or 12.6% per year over the same period. $100,000 following the newsletter became $814,749.
The same amount in a global tracker ETF became roughly $671,581.
The 1.4 percentage points per year of outperformance sounds small. Over 16 years it is a difference of $143,000 in final wealth on a $100,000 start.
| US Dollar investor, 16 years | Quant Value newsletter | World Index (total return, USD) |
|---|---|---|
| Total return | +714.7% | +571.6% |
| Annualised return (CAGR) | 14.0% per year | 12.6% per year |
| $100,000 grew to | $814,749 | $671,581 |
| Worst peak-to-trough drawdown | -20.2% | -34.0% |
| Annualised volatility | 11.4% | ~15% |
| Months positive (of 192) | 67.5% | ~65% |
A Euro Investor
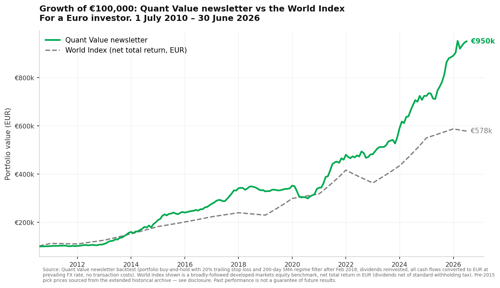
Growth of €100,000, 1 July 2010 to 30 June 2026. Total return, EUR, dividends reinvested. Source: Quant Value backtest; World Index is a broadly-followed developed-markets equity benchmark, net total return in EUR.
A Euro investor following the same newsletter over the same 16 years would have seen an even stronger relative outcome, because much of the value has come from picks outside the Eurozone and the Euro was weaker against several key currencies over parts of this period.
The Quant Value portfolio returned 850.0% in total, or 15.1% per year compounded, in Euros. A broadly-followed developed-markets World Index (net total return, EUR) returned approximately 477.7% or 11.6% per year. €100,000 following the newsletter became €949,980. The same amount in a global tracker ETF became roughly €577,720.
The 3.5 percentage points per year of outperformance is a difference of €372,000 in final wealth on a €100,000 start.
| Euro investor, 16 years | Quant Value newsletter | World Index (net total return, EUR) |
|---|---|---|
| Total return | +850.0% | +477.7% |
| Annualised return (CAGR) | 15.1% per year | 11.6% per year |
| €100,000 grew to | €949,980 | €577,720 |
| Worst peak-to-trough drawdown | -15.1% | ~-25% |
| Annualised volatility | 8.3% | ~14% |
| Months positive (of 192) | 73.3% | ~63% |
Drawdowns, and why they were shallower
The drawdown story matters as much as the return story. Over 16 years the worst peak-to-trough loss the newsletter portfolio experienced was 20.2% in US Dollar terms and 15.1% in Euro terms, both during the Covid crash of February to March 2020. The World Index fell 34% in US Dollars over the same five-week window. Both recovered, but the newsletter's shallower drawdown meant less capital had to be earned back before the compounding could resume.
The trailing stop loss and the no-buying-in-falling-markets rule did what they were designed to do. Losing positions were sold before they became crippling. New buying paused when the broader market signalled that correlations were spiking. Neither rule changed the destination — the newsletter still followed the same value screen — but they lowered the volatility of the journey.
The individual recommendations
The newsletter published 642 individual buy recommendations over 16 years. In US Dollar terms, two out of every three ended positive, one out of three negative. The average winner made 45.4%. The average loser lost 17.7% — very close to the 20% trailing stop level, which is what the rule is designed to enforce.
The winners more than paid for the losers by a ratio of 2.57 to 1.
| Individual recommendation statistics (642 picks, 16 years, USD basis) | Value |
|---|---|
| Winners | 380 (59.2%) |
| Losers | 262 (40.8%) |
| Average winner | +45.4% |
| Average loser | -17.7% |
| Win / loss ratio | 2.57 to 1 |
| Median return per pick | +8.0% |
| Best single recommendation | Celestica Inc., +351% |
| Worst single recommendation | ITT Educational Services, -86% |
Losses of the size of ITT Educational Services happen. What matters is that they are small enough and rare enough that the winners more than pay for them, which is what a 2.57-to-1 win/loss ratio means.
How this was calculated, and where the data came from
Full disclosure on methodology, because the honest track record is the whole point.
The portfolio simulation. The numbers above are from a simulation that starts on 1 July 2010 with a $100,000 (or €100,000) initial cash balance and walks forward through every buy and sell call the newsletter published. Each buy allocates its published portfolio weight of the then-current portfolio value to the pick, at that day's market close.
Each sell exits the position at that day's market close. Between events, share counts are fixed — there is no rebalancing, no topping up of winners, and no doubling down on losers.
Dividends are added to cash on payment date and recycled into the next buy.
All cash flows are converted to the reporting currency (USD or EUR) at the prevailing exchange rate that day. Cash can go negative (i.e. mild leverage is permitted) or above 100% (after a wave of sells with no new buys). NAV snapshots are taken at each month-end.
What is included. The 20% trailing stop loss on every position, applied at pick level. The no-new-investments-when-a-market-is-below-its-200-day-moving-average rule for new buys (Crash Portfolio picks are exempt from this rule). Cash dividends reinvested at gross. Currency conversion at daily FX rates.
What is not included. Transaction costs. Bid-ask spreads. Taxes. Slippage on entry or exit. In practice these matter, though for a monthly-turnover strategy with 20 to 60 holdings they are usually small relative to the returns shown.
Where the price data comes from. The primary price database that drives the simulation begins in late 2014. For 158 pick entries that opened before then, prices were taken from an extended historical archive (same split-adjusted methodology as the primary database, sourced separately).
Six early picks were rejected because their archive prices could not be reconciled and were excluded from the simulation altogether. The 200-day SMA data used for the market-trend rule is available from February 2018 onwards; the rule was introduced in December 2017, so for the earliest weeks of the rule's life the simulation could not model its effect, but only seven buys across the full 16 years were actually skipped by this filter.
How we know the pre-2015 numbers are not inflating the story. The same simulation was run for the "high-confidence" period from 1 January 2016 through 30 June 2026 — 10.5 years, entirely on the primary price database, no reliance on the extended archive at all.
That period produced a 14.1% per year US Dollar CAGR. The full 16-year figure is 14.0% per year. The two numbers essentially match. This means the extended archive is not producing artificially high returns for the early years, and the 16-year picture is internally consistent with the 10.5-year picture built purely from primary data.
| Verification: two overlapping windows | USD annualised return | EUR annualised return |
|---|---|---|
| Full 16 years (Jul 2010 – Jun 2026) | 14.0% | 15.1% |
| High-confidence period (Jan 2016 – Jun 2026, no extended archive) | 14.1% | 13.4% |
The Dollar CAGRs match to within 0.1 percentage point. The Euro CAGRs are close, with the small difference reflecting Euro-favourable currency moves that happened in the pre-2015 period rather than any archive-related distortion.
World Index figures used in the tables and charts: the developed-markets equity index annual calendar-year returns published in provider factsheets, in USD gross total return and in EUR net total return, compounded across the same 16-year window. Half-year 2010 and 2011 index returns are derived from published full-year totals and known half-year prints. Past performance is not a guarantee of future results.
See a recent issue before you decide
A monthly newsletter subscription is a real commitment. The right way to evaluate it is to read an actual recent issue, not a sales page.
Click the Get Help button at the bottom right of this page and type QV sample issue. We will email you the latest issue. Read the company write-ups, the valuation work, the rationale for each pick, and the position-sizing guidance. If it earns its place in your monthly reading, subscribe. If it does not, you keep a recent issue to refer to and you have lost nothing.
Or skip ahead — see subscription options
100% money-back guarantee for the first 30 days. No questions asked.
What 16 years gives you as a reader
Three concrete things.
You see how the strategy behaved in conditions you may face next. Back-tests tell you what would have happened. Live publication tells you what did, including the timing, the doubt, and the holding period a real investor lived through.
You inherit every lesson learned. The 20% trailing stop loss, the no-buying-in-falling-markets rule, the Market Crash portfolio framework. None of these were in the first issue. They are in every issue now. You start where it took 16 years to get to.
You get a strategy that has been audited by time. Most paid newsletters do not last 5 years. The ones that do tend to drift, chasing whichever theme is performing this quarter. This one has not. The screen is the screen. The rules are the rules. The newsletter publishes whether the market is up, down, or sideways.
Frequently asked questions
1. How long has the Quant Value newsletter been published?
16 years, with 192 monthly issues delivered every month without a gap since 19 July 2010. The first issue was published one and a half years after the March 2009 market low.
2. Who writes the Quant Value newsletter?
Tim du Toit. 39 years of investing experience (started 1987), MBA Finance (Indiana University), 16 years in banking and fund management, and author of "Quantitative Value Investing in Europe: What Works for Achieving Alpha".
3. What kind of companies does the newsletter recommend?
Quality undervalued small-cap stocks, with a global focus (Europe, North America, Asia Pacific). The screen looks for low valuation ratios combined with high quality and improving momentum. Up to six new ideas per monthly issue.
4. Has the newsletter's strategy changed since 2010?
Yes. Three rules were added from real losses: a strict 20% trailing stop loss (introduced March 2015), no new investments when a market is trading below its 200-day simple moving average (introduced December 2017), and a separate Market Crash portfolio with stricter quality ratios (introduced April 2020 during COVID).
5. Did the newsletter publish through the Covid crash and the 2022 bear market?
Yes. Every single month since 19 July 2010 without exception, through the 2011–2012 European sovereign debt crisis, the 2015 China selloff, the 2016 oil price collapse, the Q4 2018 correction, the March 2020 Covid crash, the 2022 bear market, and three years of rate hikes from 2022 onwards.
6. Where can I see the long-term performance of the newsletter?
The 16-year summary is in the "Performance over 16 years" section above, in both US Dollars and Euros. The full month-by-month track record and current live positions are on the Performance page.
7. Can I see a sample issue before subscribing?
Yes. Click the Get Help button at the bottom right of any page on quant-investing.com and type "QV sample issue". A recent issue will be emailed to you so you can read the company write-ups, valuation work, and position-sizing guidance before paying anything.
8. What is the refund policy?
100% money-back guarantee for the first 30 days. Cancel any time, no questions asked.
Subscribe to the Quant Value newsletter
192 issues delivered. The next one ships at the end of this month, with the same screen, the same rules, and the same willingness to publish drawdowns alongside winners.
100% money-back guarantee for the first 30 days. Cancel any time, no questions asked.