

This the editorial of our monthly Quant Value Investment Newsletter published on 2022.12.06. Sign up here to get it in your inbox the first Tuesday of every month.
More information about the newsletter can be found here: This is how we select ideas for the Quant Value investment newsletter
This month we take a close look at the 200-day simple moving average rule, why and how it works and if we can improve it.
But first the portfolio updates.
Portfolio Changes
Europe – Buy Two – Sell Two – Hold One
Two new recommendations this month as the index is above its 200-day simple moving average.
The first is a UK-based footwear retailer attractively undervalued, trading at Price to Earnings ratio of 8.2, Price to Free Cash Flow of 2.7, EV to EBIT of 6.5, EV to Free Cash Flow of 3.3, Price to Book of 3.4.
The second is a French television broadcaster with no net debt, trading at a bargain price of 6.8 times Earnings, Price to Free Cash Flow of 4.6, EV to EBIT of 3.9, EV Free Cash Flow of 3.9, Price to Book of 0.9. It also has an attractive Dividend Yield of 6.1%.
Sell Centrica PLC (+59.2%) as it no longer meets the newsletter’s selection criteria.
Sell Linedata Services SA (+36.1%) If you bought Linedata in June last year you most likely received information on the stock buyback tender offer at €50.00 per share. Tender your shares before 22.12.2022 for a quick 36% profit.
Hold Naturhouse Health S.A. (-3.0%) as it still meets the portfolio’s selection criteria.
North America – Buy One
One new recommendation this month as the index is above its 200-day simple moving average.
The company is an undervalued US educational services provider trading at Price to Earnings ratio of 9.2, Price to Free Cash Flow of 6.8, EV to EBIT of 3.4, EV Free Cash Flow of 3.4, Price to Book of 1.4.
Asia – Buy One – Sell One – Hold Two
One new recommendation this month as the Japanese index is above its 200-day simple moving average.
It is a cheap Japanese company that sells digital home appliances. It is attractively priced at a Price to Earnings ratio of 4.4, Price to Free Cash Flow of 3.7, EV to EBIT of 3.1, EV Free Cash Flow of 3.3, Price to Book of 0.9. It is buying back shares and pays a dividend of 1.9%.
Sell Okinawa Cellular Telephone Company (+14.8%) as it no longer meets the newsletter’s selection criteria.
Hold Artnature Inc. (+13.3%) as it still meets the portfolio’s selection criteria.
Hold Exedy Corporation (+3.7%) as it still meets the portfolio’s selection criteria.
Crash Portfolio – Buy One
One Crash Portfolio recommendation this month.
It is a VERY undervalued Hong Kong-based manufacturer of chemicals trading at Price to Earnings ratio of 3.0, Price to Free Cash Flow of 4.1, EV to EBIT of 2.6, EV Free Cash Flow of 4.3, Price to Book of 0.8. It also has an attractive Dividend Yield of 10.1%.
Does the 200-day moving average rule react too slowly and lowers your returns?
Subscribers have asked a lot of questions about the 200-day simple moving average (SMA) rule so we did some research to address their concerns.
Here are a few examples of the questions (Bold text mine):
Perhaps it's an obvious insight, but the 200-day SMA keeps you largely in the market during a bull-cycle, but also keeps you largely out of the market during prolonged periods of decline. Yet within these decline cycles are also many bull-rallies this approach may miss.
How do you feel about using the VIX as a measure for market momentum rather than the 200-day moving average? I am wondering because it seems that if I wait for the market to be above the 200-day moving average then I might miss some really game-changing market days.
These are valid concerns; you have perhaps also thought of.
But is it true that the 200-day SMA rule will let you miss out on:
- Substantial one, or multiple day positive gains?
- Keep you out of a market, for long periods of time?
What does the rule say
Before we go further let us first look at what the 200-days simple moving average (SMA) rule says:
Do not buy if the markets are falling!
The newsletter only recommends new investment ideas if the moving average of the respective market index is above its 200-day simple moving average (SMA).
For example, only if the S&P500 index is above its 200-day SMA, and we can find good, undervalued companies, will we recommend investment ideas in North America.
If the S&P500 index is below its 200-day SMA, no North American companies will be recommended because it means the market is falling.
The 200-day SMA rule only applies to new investment ideas – on the first Tuesday of each month, the stop loss strategy (see below) still applies.
It is important to note that the rule does not lead to the selling of existing ideas. They stay in the portfolio.
Let's look at the data - over 89 years
To find an answer to the question we looked at the research and found a great study called: Leverage for the Long Run - A Systematic Approach to Managing Risk and Magnifying Returns in Stocks by Michael A. Gayed, and Charles V. Bilello
In the paper they compared the buy and hold performance of the S&P 500 index against different moving averages over a period of over 89 years from October 1928 until October 2015.
They tested a trading rule which:
- Buys the S&P 500 Index if it trades above its 200-day Simple Moving Average and
- Sells the S&P 500 Index (rotating into 3-month Treasury bills) below its 200-day Moving Average.
Performance in bull markets
If you measure the return in a bull market from the point where the chart turns upwards the 200-days SMA rule will definitely underperform. This is because only after the index crosses the 200-day average line will you buy the index.
This can clearly be seen in the following table:
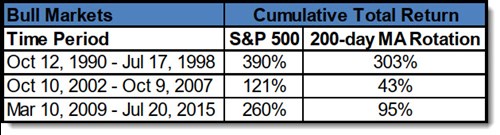
Source: Leverage for the Long Run - A Systematic Approach to Managing Risk and Magnifying Returns in Stocks
Performance in bear markets
It is in bear markets where the 200 days SMA rule really shines.
The table below shows that the rule really keeps your losses low.
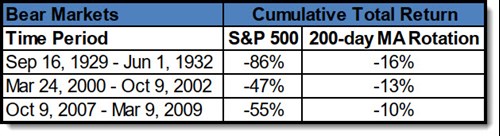
Source: Leverage for the Long Run - A Systematic Approach to Managing Risk and Magnifying Returns in Stocks
This is the main benefit of the SMA rule, it keeps losses low, and this makes it a LOT easier to stick with your investment strategy.
Just think about how much easier it is to stay invested after a loss of 16% compared to the loss of 86%!
Would you stick with your investment strategy after it loses 86%?
Bull and bear market combined performance
As you have seen, if you applied the 200-days SMA rule you would have lagged bull markets but substantially outperformed in bear markets.
What would your returns have been if you combine bull and bear markets?
This is what I did with the following table (the research paper did not include this) and the results are really surprising.
To compile the table, I combined the bull and bear market returns and calculated the return on an amount of 100 invested in both strategies.
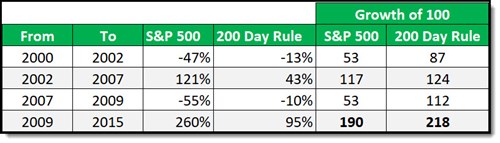
Source: Quant Investing calculations
The 200-days SMA rule applied to the S&P 500 index outperformed a buy and hold strategy with an end value of 218 compared to 190.
So not only did you get the benefit of emotionally being able to stick to your strategy (the S&P 500 in this case) but you also would have had higher returns.
What is not to like about that!
What about volatility
The following chart shows you the volatility after S&P500 index when it is trading above and below different simple moving averages values (on the horizontal axis).
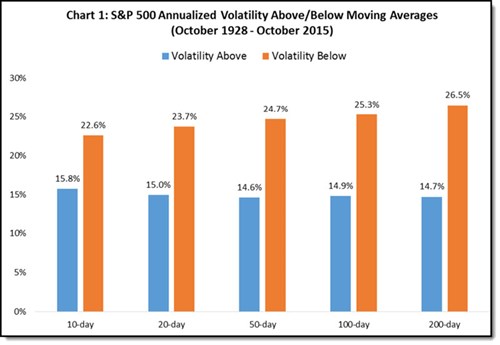
Source: Leverage for the Long Run - A Systematic Approach to Managing Risk and Magnifying Returns in Stocks
As you can see, for all SMA values (10 to 200 days) the volatility is substantially lower when the market is trading above the simple moving average value (the blue bars).
If the market is below the SMA volatility was up to 80% higher, and on average 64% higher across all moving average values.
What about other markets
The researchers found similar results in other markets. For example:
- The Russell 2000 Index has an annualized volatility of 7% above its 200-day moving average versus 26.5% below it (1979-2015).
- The CRB Commodities Index has an annualized volatility of 9% above its 200-day Moving Average versus 18.5% below it (1994-2015).
- The Merrill Lynch High Yield Index has an annualized volatility of 2.9% above its 200-day Moving average versus 7.2% below it (1990-2015).
Annualised return above and below moving averages
In the chart below they compared the annualised return of the index when it is above and below different moving averages.
Only in two cases was the annualised return positive when the index was below the moving average positive (20 and 50-days SMA). And then only barely so plus at +0.4%.
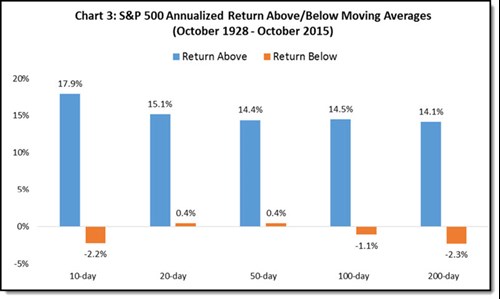
Source: Leverage for the Long Run - A Systematic Approach to Managing Risk and Magnifying Returns in Stocks
The chart clearly shows that it is good to be out of the market if it is trading below the moving average.
It is interesting to note is that the avoidance of negative returns already happens at a moving average of 10 days!
The key insight to making maximum use of the SMA in strategy is not about being exposed to equities above it, but rather in avoiding higher equity downside volatility below it.
The worst 1% of trading days
Can a SMA strategy help you avoid the worst trading days?
Yes, it can as the chart below shows. It shows you what percentage of worst trading days took place when the market was trading below the SMA.
For example, you would have avoided 74% of the worst trading days if you were out of the market if it was trading below its 20 or 50-days SMA.
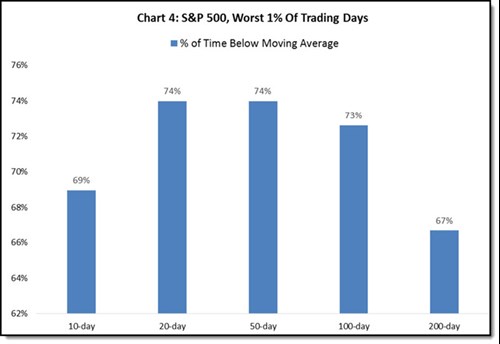
Source: Leverage for the Long Run - A Systematic Approach to Managing Risk and Magnifying Returns in Stocks
The data includes the two worst days in market history: October 19th in 1987 and October 28th in 1929. Before both these days the market was already below all major moving averages - 10-days to 200-day.
What about positive streaks
The research did not mention if the SMA strategy let you miss out on the best 1% of trading days. BUT they did look at positive streaks - consecutive days of positive market movements – and if they took place above or below the SMA.
The following chart shows you what percentage of positive streaks took place above and below 200-days SMA.
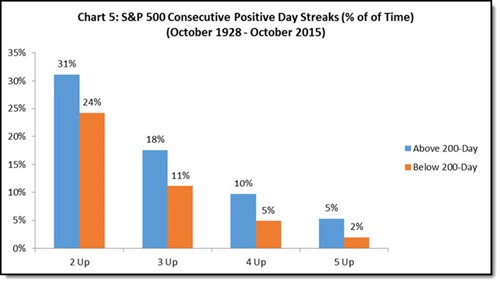
Source: Leverage for the Long Run - A Systematic Approach to Managing Risk and Magnifying Returns in Stocks
As you can see more positive streaks took place when the market above its SMA.
So, the idea that that you will miss out on most of the positive days if you try to time the market with a SMA is simply not true.
You will miss out on some of them for sure but not the most of them.
Overall returns with and without a moving average
The following table from the research paper shows you the returns of a buy and hold S&P 500 investor compared to S&P 500 + SMA market timing investor.
The strategy was:
- Buy the S&P 500 Index if it trades above the SMA
- Sells the S&P 500 Index and buy 3-month Treasury bills it is below the SMA
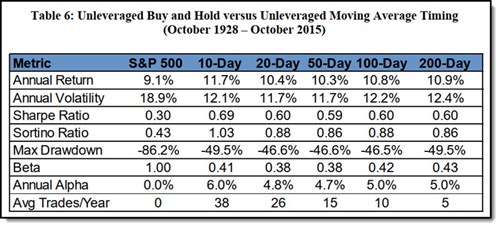
Source: Leverage for the Long Run - A Systematic Approach to Managing Risk and Magnifying Returns in Stocks
As you can see this SMA strategy increases annual returns, decreases volatility, and most importantly your maximum drawdown decreases substantially.
This increases your risk-adjusted performance, which is EXACTLY what you want!
A further example:
The researchers also found that the SMA rule beats buy-and-hold in absolute performance in only 49% of rolling 3-year periods. This is because the SMA can whipsaw (lets you buy and sell) you in sideways or trendless periods.
However, in terms of risk-adjusted outperformance, the SMA beats the market in 69% of rolling 3-year periods.
As mentioned, this is the MOST important point because of the unspoken flaw of ALL buy-and-hold strategies: that almost NO ONE holds through large drawdowns.
Drawdowns shown graphically
The following chart shows you just how much your drawdowns would be reduced, in all bear markets since 1928, if you used a 200-days SMA strategy – Blue line (market = yellow line).
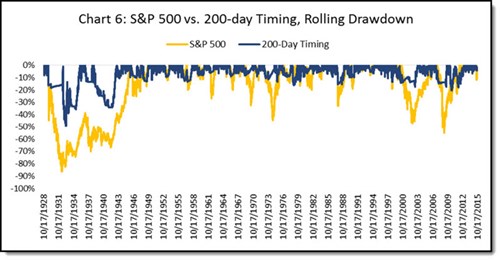
Source: Leverage for the Long Run - A Systematic Approach to Managing Risk and Magnifying Returns in Stocks
This is the best example from the study. You can see the decrease in your total drawdowns (the biggest factor that lets you stick to your investment strategy) is substantially lower.
Summary and conclusion
Okay this is a lot of data that I hope also convinced you – it did for me that:
- It is important to reduce your equity exposure when the market is below its SMA
- This reduces your overall losses
- Which lets you stick with your investment strategy
But what about the investments that remain in your portfolio because the newsletter’s SMA rule only says - stop buying when a market is below its SMA.
The trailing stop loss rule still applies to all remaining ideas. So, they will be sold as soon as they fall 20% their all-time high. We keep them in the portfolio as the newsletter’s investment strategy recommends companies with strong positive momentum. This means they are already moving up and the strategy sells them when this positive movements reverses.
Further research
As you have seen SMA values less than 200-days also seem to work just as well. We are going to do some research to see if the 200-days can be reduced to 50 or 100-days for example.
This will lead to a faster reaction to stop buying when markets are falling but also to start buying earlier when they turn up again.
Click here to start finding ideas that EXACTLY fit your investment strategy NOW!
