

You know we continuously improve the stock screener to help you find the best possible investment ideas.
We do this because, we of course want to keep you as a subscriber, but there is another reason, one I am sure will you will find very convincing.
I use the screener for my own investments so I have a strong incentive to make sure that only the best strategies and tools are available on the screener.
In this article want to show you what we have added recently added to the screener and what we are developing and will be available soon.
Available soon
Let me start with something that will be available soon, something I am sure you will find helpful as a lot of subscribers have asked for this already.
Build your own watch-list
Soon we will be adding a watch-list feature to the screener.
The watch-list will allow you to build portfolios (as many as you like) and save them in the screener so that you can open them at any time with a few mouse clicks.
When you save a watch-list you can select all the ratios and indicators you would like to see when you open it.
You can then quickly see, for example, if the Piotroski F-Score of any of your investments is deteriorating or if a company has become overvalued in terms of your favourite valuation measure, earnings yield, for example.
Tools you can use right now
We have also added a few tools that that you can start using immediately.
We have not found a final place for them yet but to allow you to start using them now we have added them to the Tactical Asset Allocation Dashboard page.
To go there simply log into the screener, scroll down, and click on the Go to Dashboard button as shown below.
On the next page scroll down to the bottom until you see a list of files that look like this:
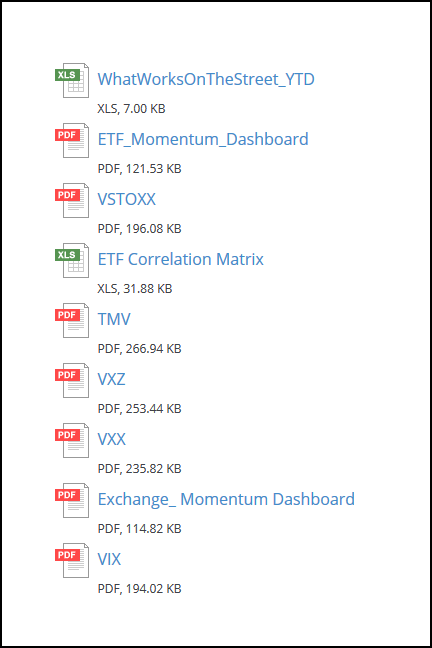
I will now give you a short description of all the tools included in the list.
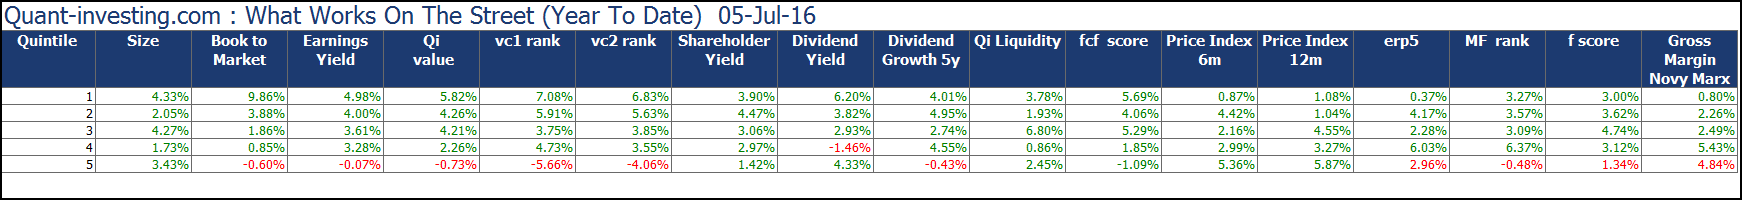
What works on the street
The first file is a Microsoft Excel file called WhatWorksOnTheStreet_YTD.
This file gives you the year to date return of 17 investment strategies applied to about 7,000 companies world-wide.
Only companies worth more than $50 million
We excluded companies with a market value less than $50 million, to make sure the returns come from companies you can easily buy and sell.
Markets worldwide
We included markets worldwide because only when you look at markets worldwide can find the best companies that fit the 17 strategies tested.
Companies registered in the following markets are included:
- USA
- Canada
- Eurozone countries
- United Kingdom
- Switzerland
- Norway
- Denmark
- Sweden
- Australia
- New Zealand
This gives you a list of about 7,000 companies.
How to Read the table
In all the return calculations we divided the 7,000 companies into five 20% groups called Quintiles.
Quintile 1 includes the companies that had the best value of the ratio or indicator we tested.
For example, with the price to book ratio Quintile 1 includes all the companies with the lowest price to book ratio and with the Value Composite One ranking, Quintile 1 includes all the companies with the best ranking.
Click image to enlarge
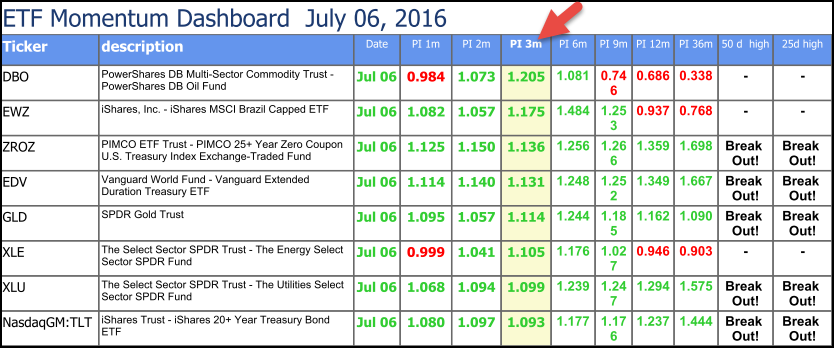
Quickly see what sectors are moving world-wide
The next file is called ETF Momentum Dashboard and is a PDF file that shows you the share price momentum of over 40 Exchange Traded Funds (ETF) worldwide.
This gives you an a unique insight as to what industries have been moving up and down over the short (from 1 month) to medium (36 months) term. This can help you to identify profitable trends to invest in.
You can also see four moving average direction indicators from 20 to 200 days.
Click image to enlarge
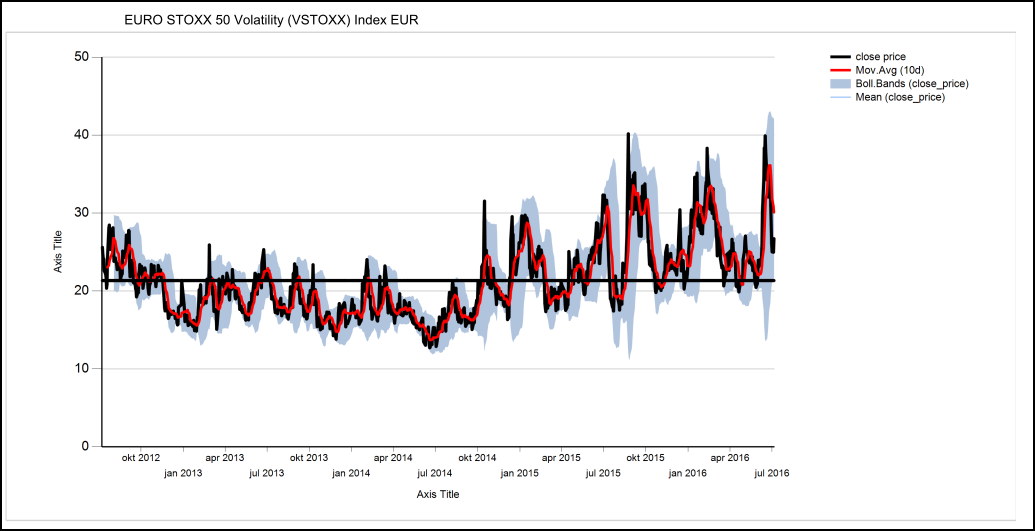
European large cap volatility
The PDF file VSTOXX (EURO STOXX 50 Volatility) shows you the short and long-term volatility of the EURO STOXX 50 companies (large company index for the Eurozone) calculated using implied volatilities of options prices.
You can read more about the VSTOXX here: EURO STOXX 50 Volatility
Click image to enlarge
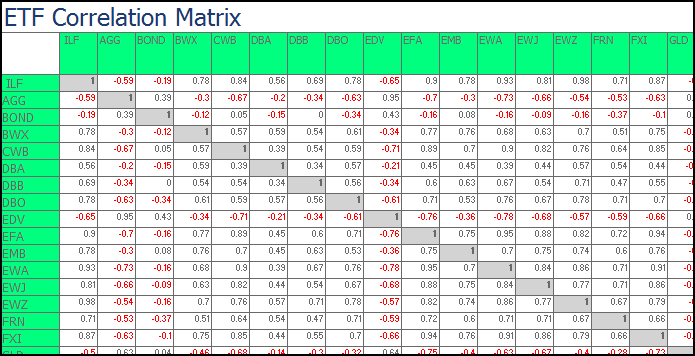
ETF Correlation Matrix
The Microsoft Excel file called ETF Correlation Matrix shows you the correlation (how strongly linked the movements are) of 49 different Exchange Traded Funds over the last 20 trading days.
It is thus a short term indicator.
Click image to enlarge
Is it a good hedge?
You can use this information, for example, to see how correlated commodities are to the S&P 500. If they are negatively correlated (have a negative value) then you may be able to hedge the risk that the S&P 500 may fall by buying a commodity ETF and the other way around.
Get the full ETF name
The table uses the security codes of the ETF’s in the table. You can however easily find the full names of the ETF with Google Finance
20 Year US Treasury leveraged bear index
The PDF file TMV shows you the movement of the Direxion Daily 20 Year Plus Treasury Bear 3x Shares exchange traded fund (TMV).
The Direxion Daily 20 Year Plus Treasury Bear 3x Shares exchange traded fund gives you the return of 300% (3 times the return) of the inverse (or opposite) of the price performance of the ICE U.S. Treasury 20+ Year Bond Index.
The ICE U.S. Treasury 20+ Year Bond Index is a market value weighted index designed to measure the performance of U.S. dollar-denominated, fixed rate securities with minimum term to maturity of greater than twenty years.
What the TMV ETF does
Normally if long term interest rates increase bond prices fall but because the TMV ETF returns the inverse (opposite) if this it means if interest rates increase it will also increase and by 3 times the movement because the ETF in leveraged 3 times.
You would thus buy the TMV ETF if you think long term (20 year and longer) interest rated in the USA are going to increase.
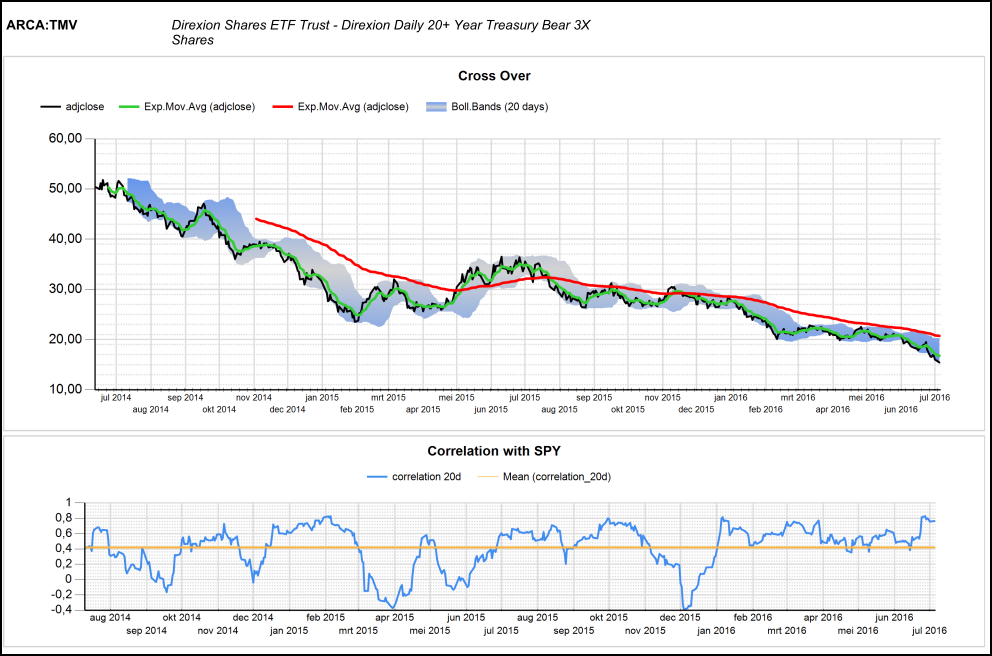
Click image to enlarge
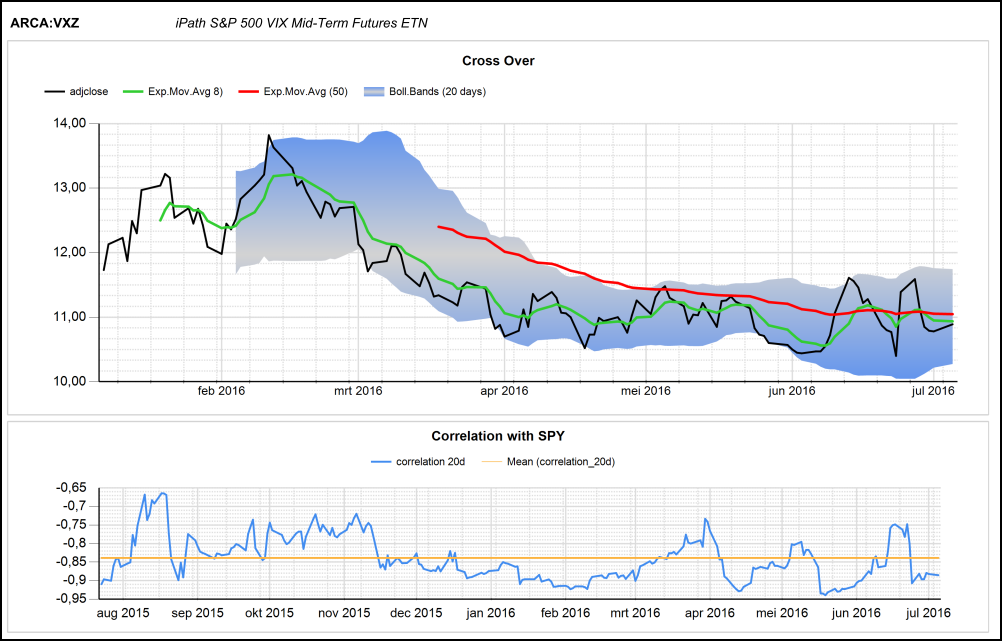
S&P 500 Mid-Term Volatility
The PDF file VXZ shows you the movement of the S&P 500 VIX Mid-Term Futures Exchange Traded Note (VXZ).
It basically shows you the expected volatility of the S&P 500 index fourth, fifth, sixth and seventh month into the future. It thus gives you a good idea of the current level of stress (or fear) in the US stock market looking five to seven months into the future.
Click image to enlarge
S&P 500 Short-Term Volatility
The PDF file VXX shows you the movement of the S&P 500 VIX Short-Term Futures Exchange Traded Note (VXX).
It shows you the expected volatility (stress or fear) of the S&P 500 index one and two months into the future.
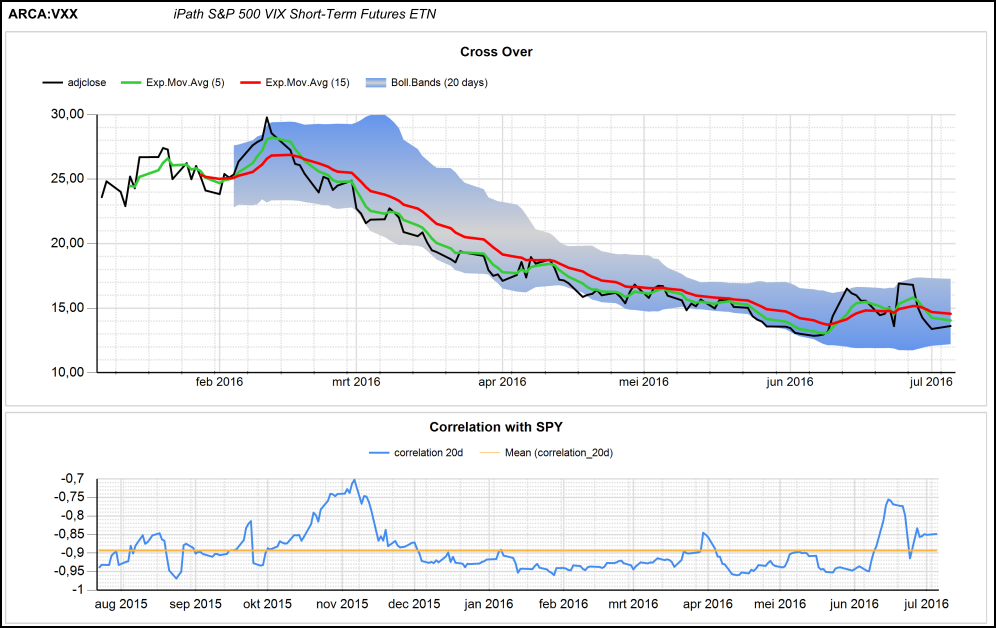
Click image to enlarge
Exchange Momentum Dashboard
The PDF file Exchange Momentum Dashboard shows you the price movements of 42 world stock market indices.
This shows you exactly what stock markets and indices world-wide have moved up and down over the short (from 1 month) to medium (36 months) term.
You can also see the market directions with four moving average indicators from 20 to 200 days.
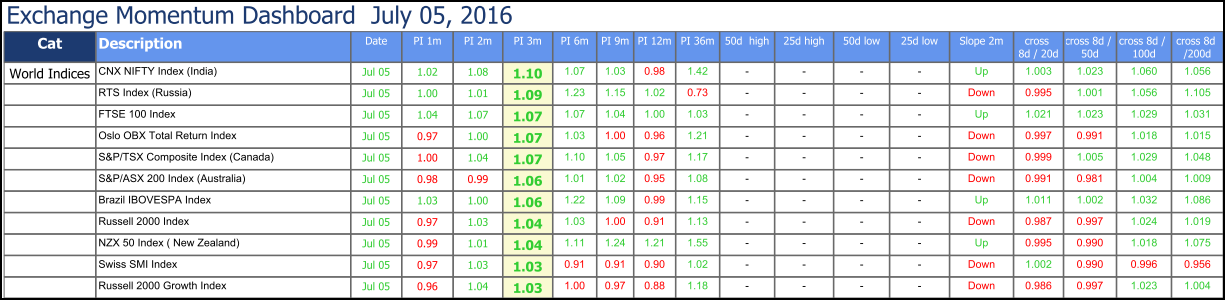
Click image to enlarge
USA stock market volatility
The PDF file VIX shows you a chart of the CBOE Volatility Index (VIX) which measures the expected short term volatility of the US stock market through the use of the S&P 500 stock index option prices.
Greed and fear index
The media likes to use the VIX as a greed and fear index, with fear high when the index is high, but the VIX index simply shows you how volatile (big the up or down movement) the index is. Larger up and down movements will increase the VIX and the other way around.
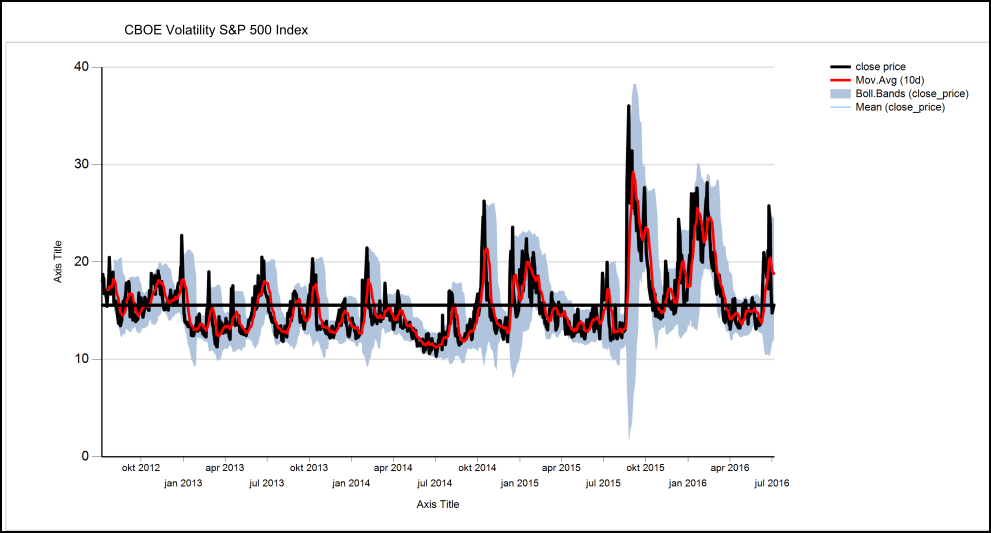
Click image to enlarge
I am sure you will find all these tools helpful.
Your ideas are always welcome
If you have any comments on these tools on how we can improve them or additional tools you may find helpful please let me know through our contact page.
PS Get access to all these tools, as well as more than 110 ratios and indicators, to help you increase your returns click here: Screener join now
PPS It is so easy to get distracted, why not sign up right now?
