

If you invest your own money, this article shows you how the new Quant Investing company dashboard helps you make faster, smarter decisions.
You get a complete view of any company in seconds, with over 110 ratios updated daily and organised into seven clear tabs.
You can quickly spot trends, compare stocks, and assess value without juggling multiple tools or spending hours on research. This upgrade saves you time, improves your accuracy, and helps you invest with greater confidence.
Estimated Reading Time: 6 minutes
Quant Investing Launches Powerful New Company Dashboard to Help You Make Smarter, Faster Investment Decisions
August 7, 2025
If you invest your own money, Quant Investing has just made your life easier, and your analysis faster.
The updated company dashboard gives you everything you need to evaluate a stock at a glance.
With over 110 financial ratios updated daily, the dashboard is now split into seven easy-to-navigate tabs: Overview, Valuation, Momentum, Quality, Growth, Charts, and Comparison.
This upgrade was built for private investors like you. Whether you are focused on value, momentum, dividends, or quality stocks, you can now dive deeper into any company, without needing multiple tools or hours of manual research.
What You Will See in the New Dashboard
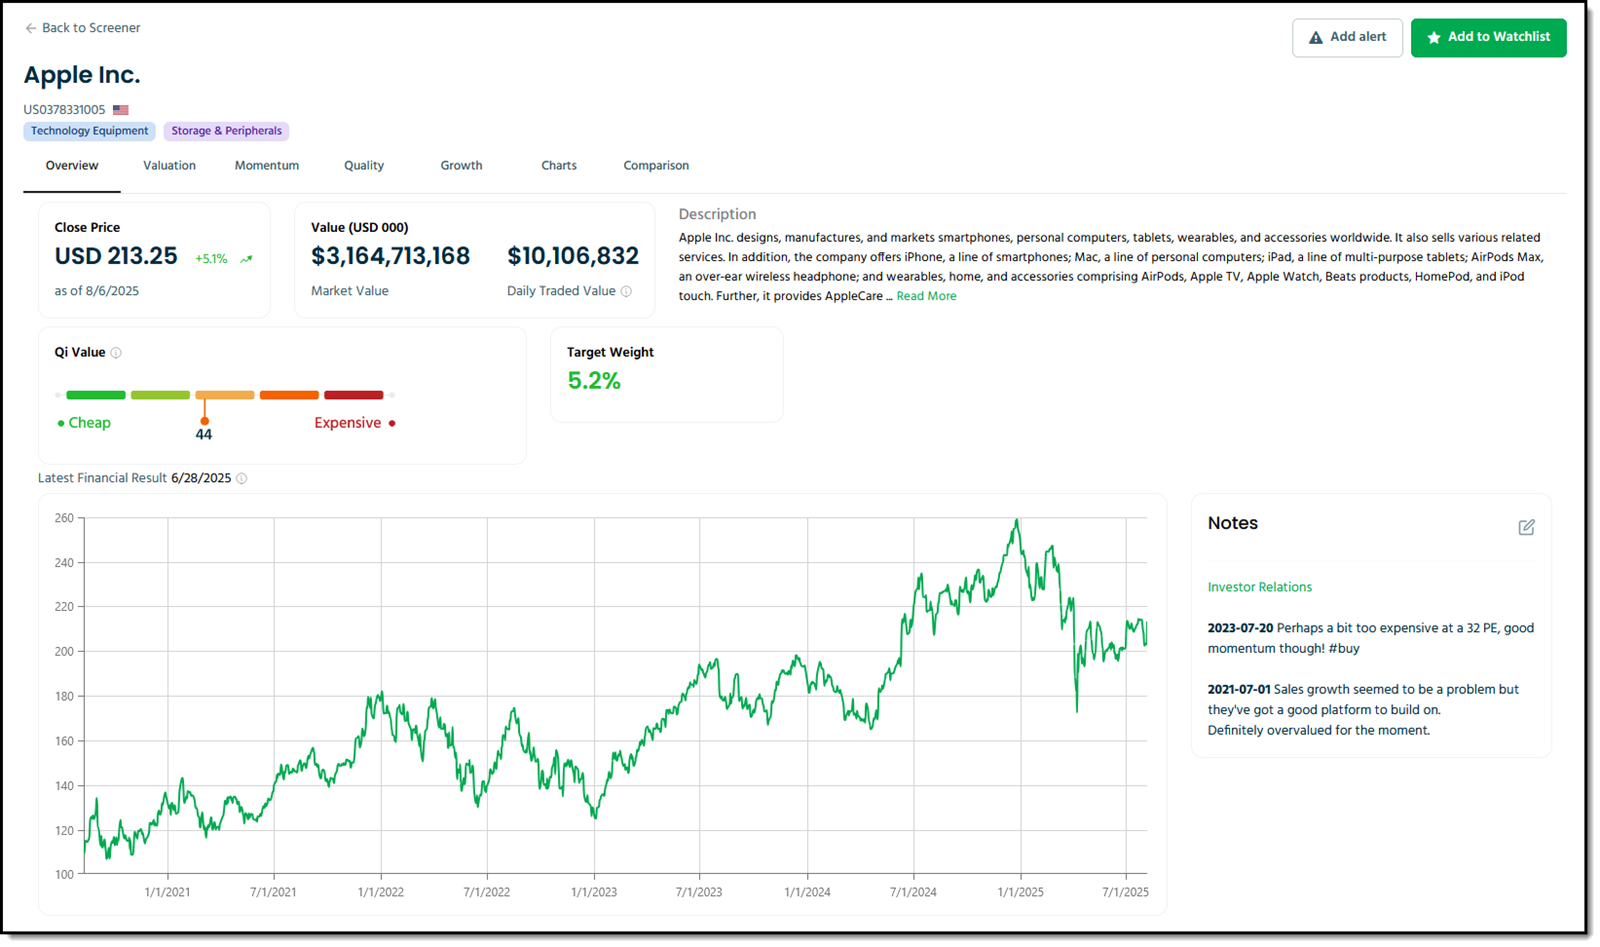
1. Overview Tab
Gives you a snapshot of the company:
-
Current price and market value
-
Qi Value score (our key valuation metric)
-
Target portfolio weight
-
5-year price chart
-
New editable notes section, now with rich formatting
Click Image to enlarge
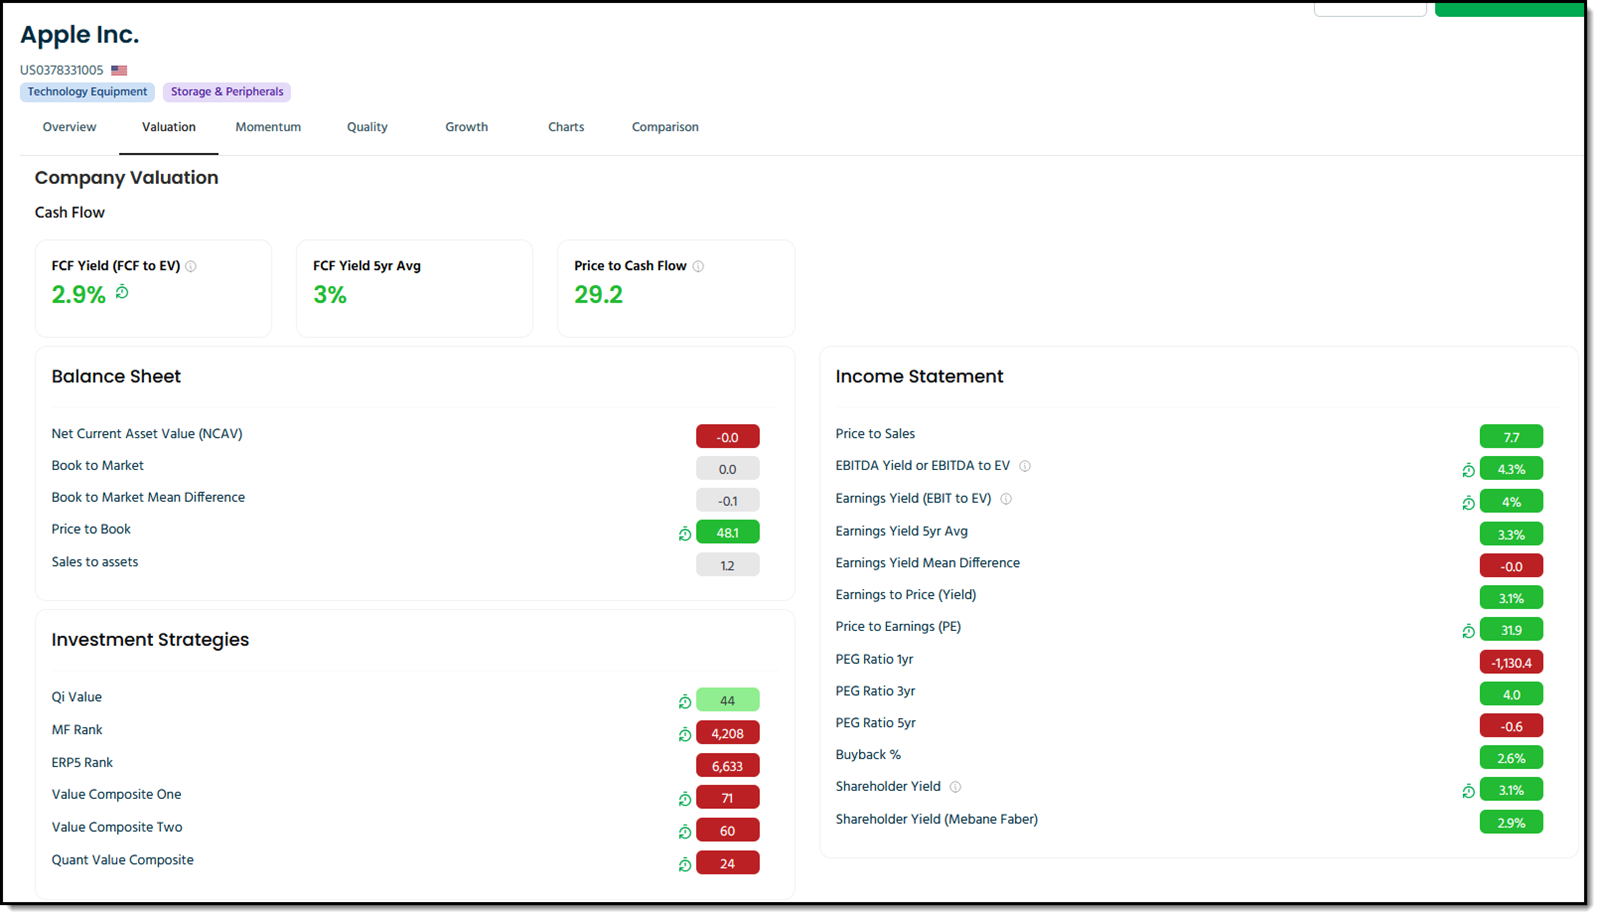
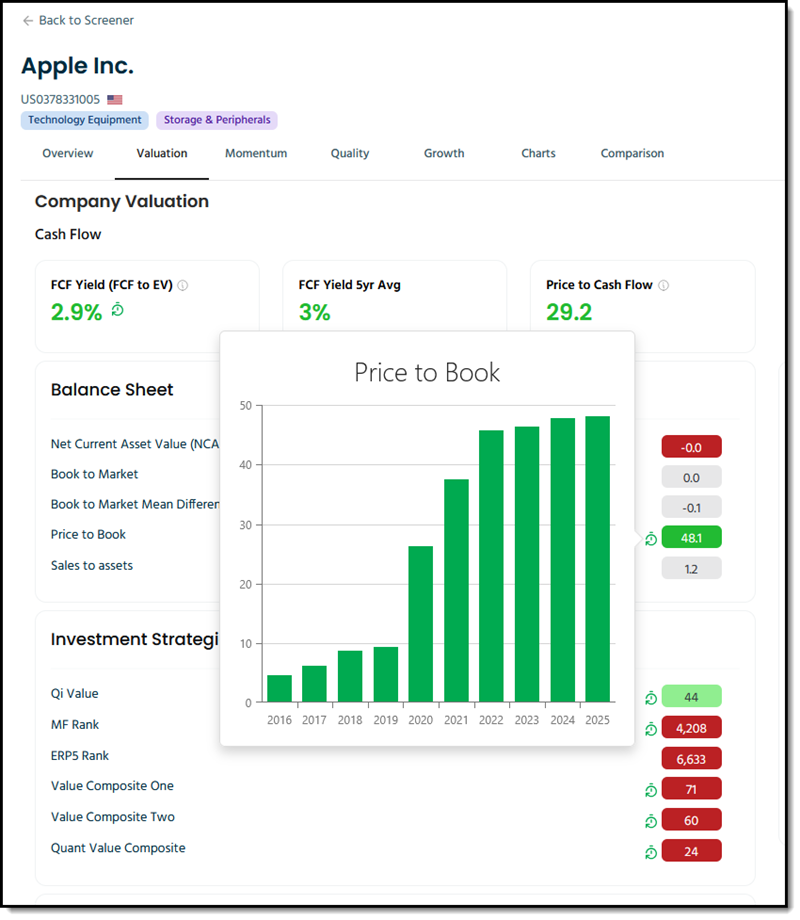
2. Valuation Tab
Breaks down over 30 valuation ratios:
-
Balance sheet and income statement ratios
-
Dividend yield and payout info
-
Valuation scores from six major investment strategies
-
Growth metrics from 3 to 10 years
Click Image to enlarge
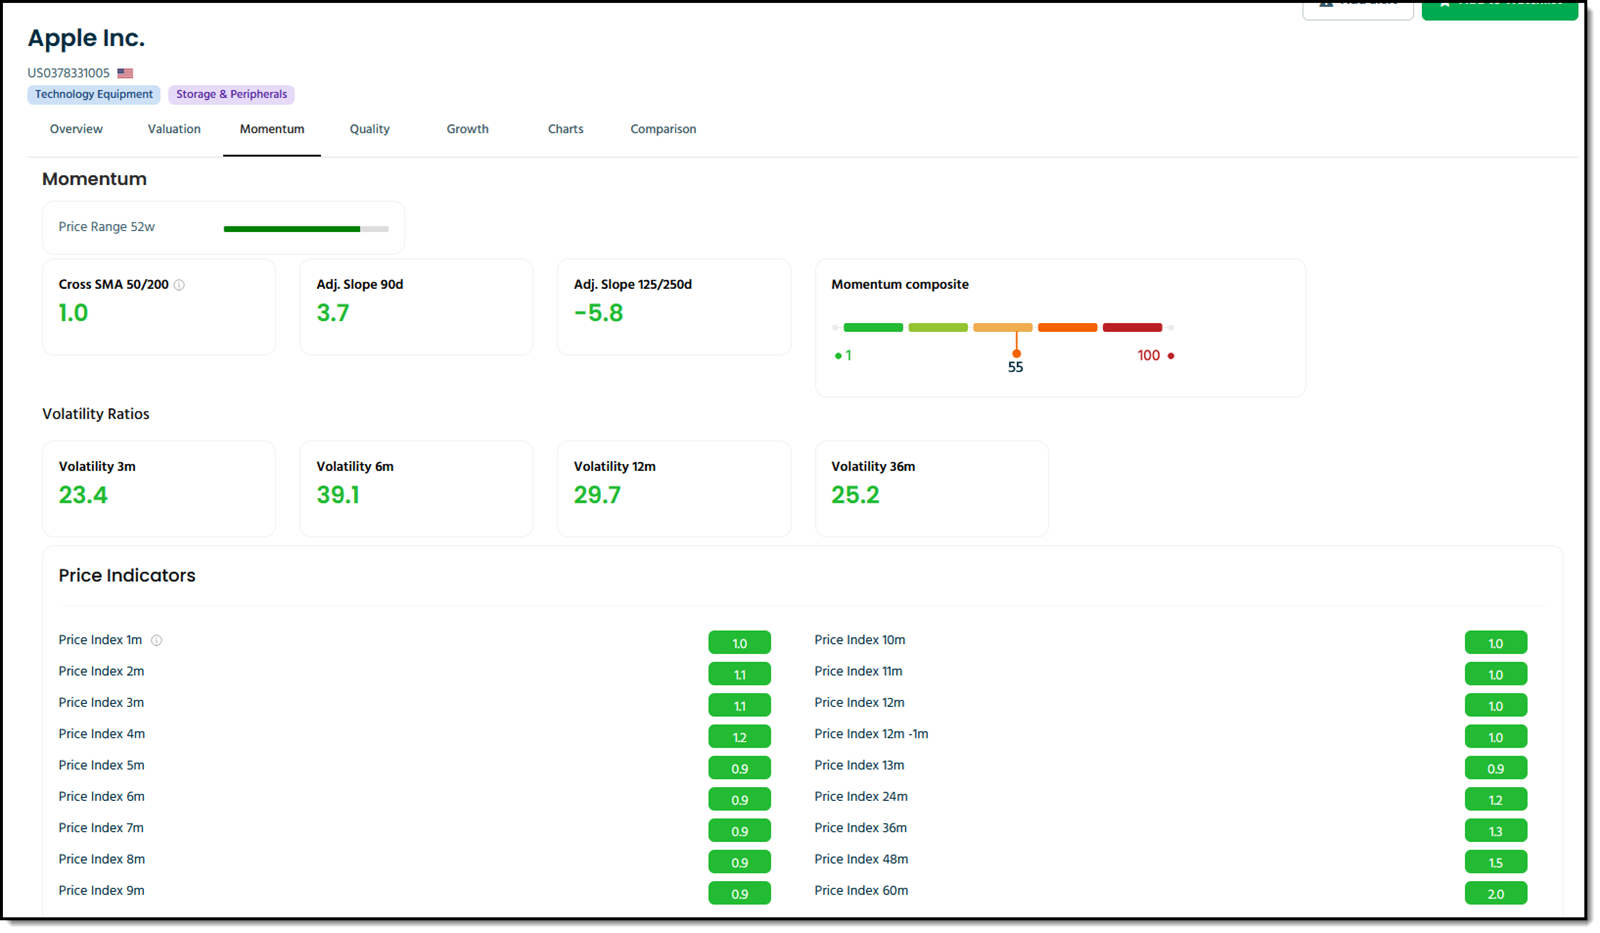
3. Momentum Tab
Shows you short and long-term price trends:
-
1-month to 5-year price index
-
Simple moving averages
-
Momentum slope ratios
-
Volatility over 12 and 36 months
Click Image to enlarge
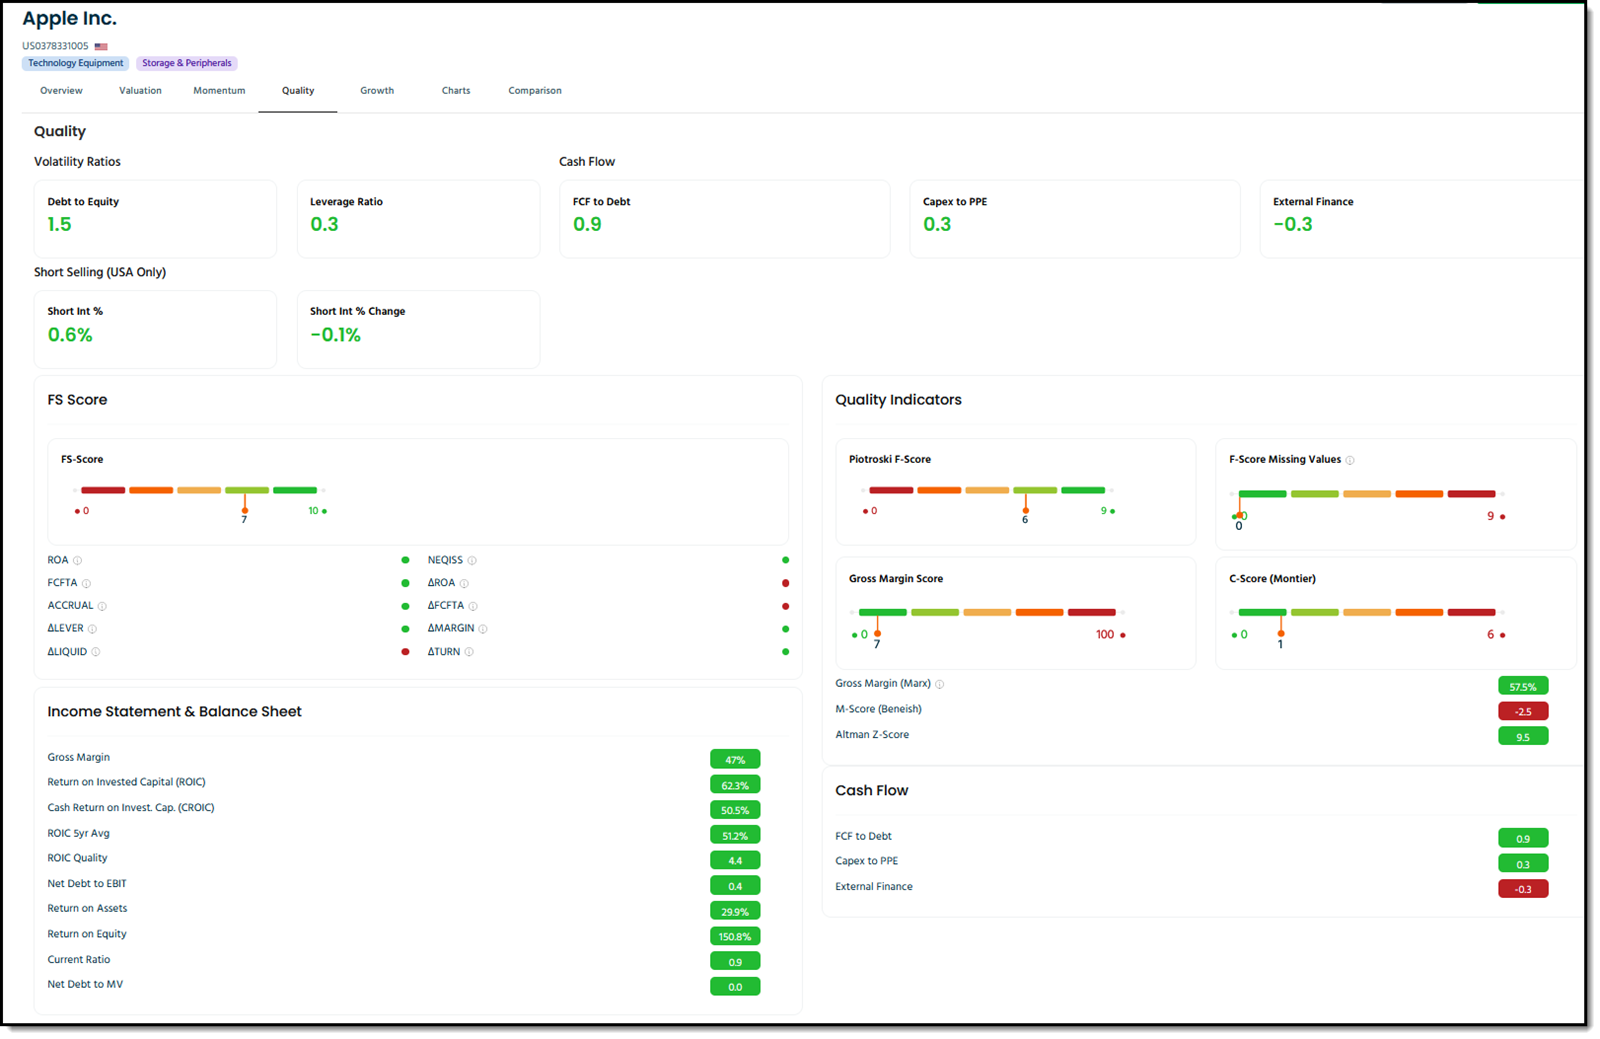
4. Quality Tab
Highlights financial strength and earnings reliability:
-
20+ key ratios, including Debt-to-Equity
-
FS Score, Piotroski F-Score, and Altman Z-Score
-
Beneish M-Score and Gross Margin from Novy-Marx
Click Image to enlarge
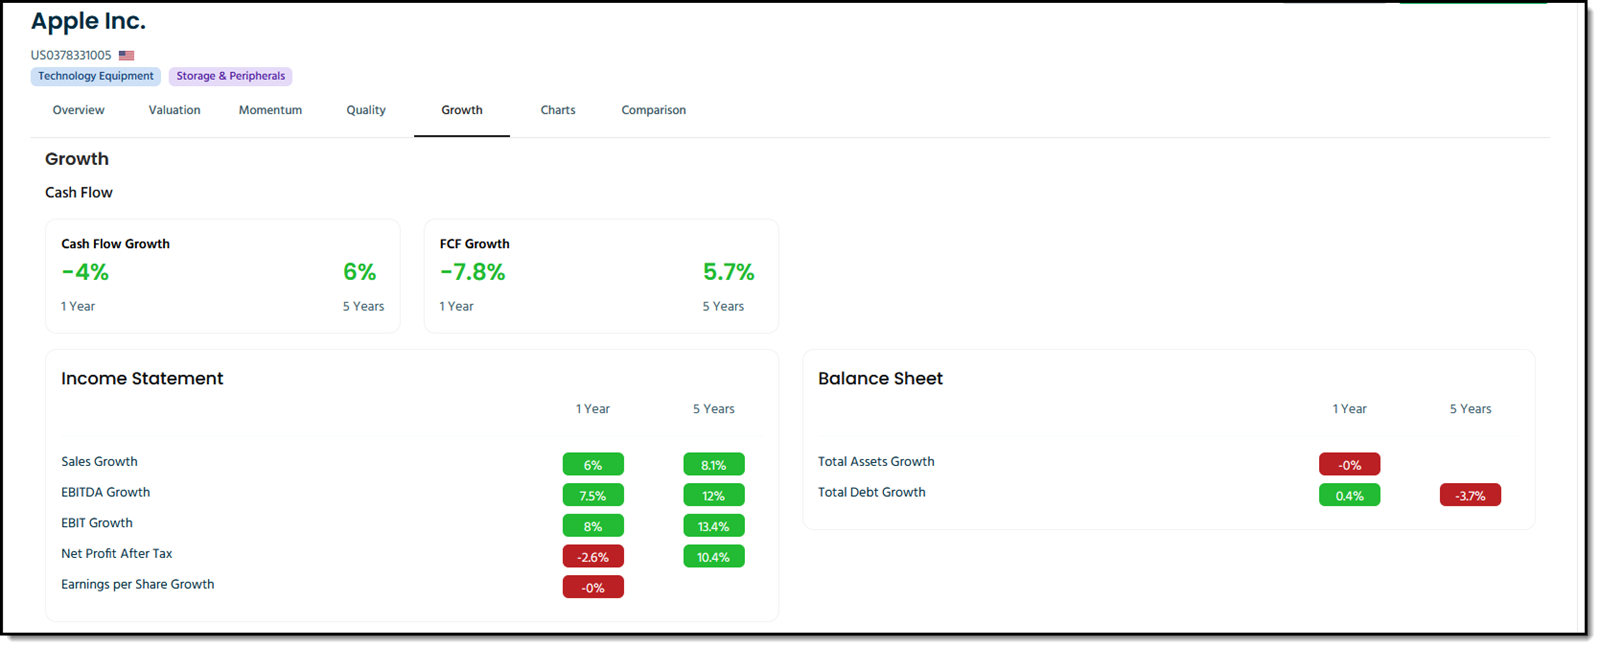
5. Growth Tab
Tracks financial expansion across time:
-
1-year and 5-year growth in cash flow, earnings, sales, and debt
-
Total assets and free cash flow growth
Click Image to enlarge
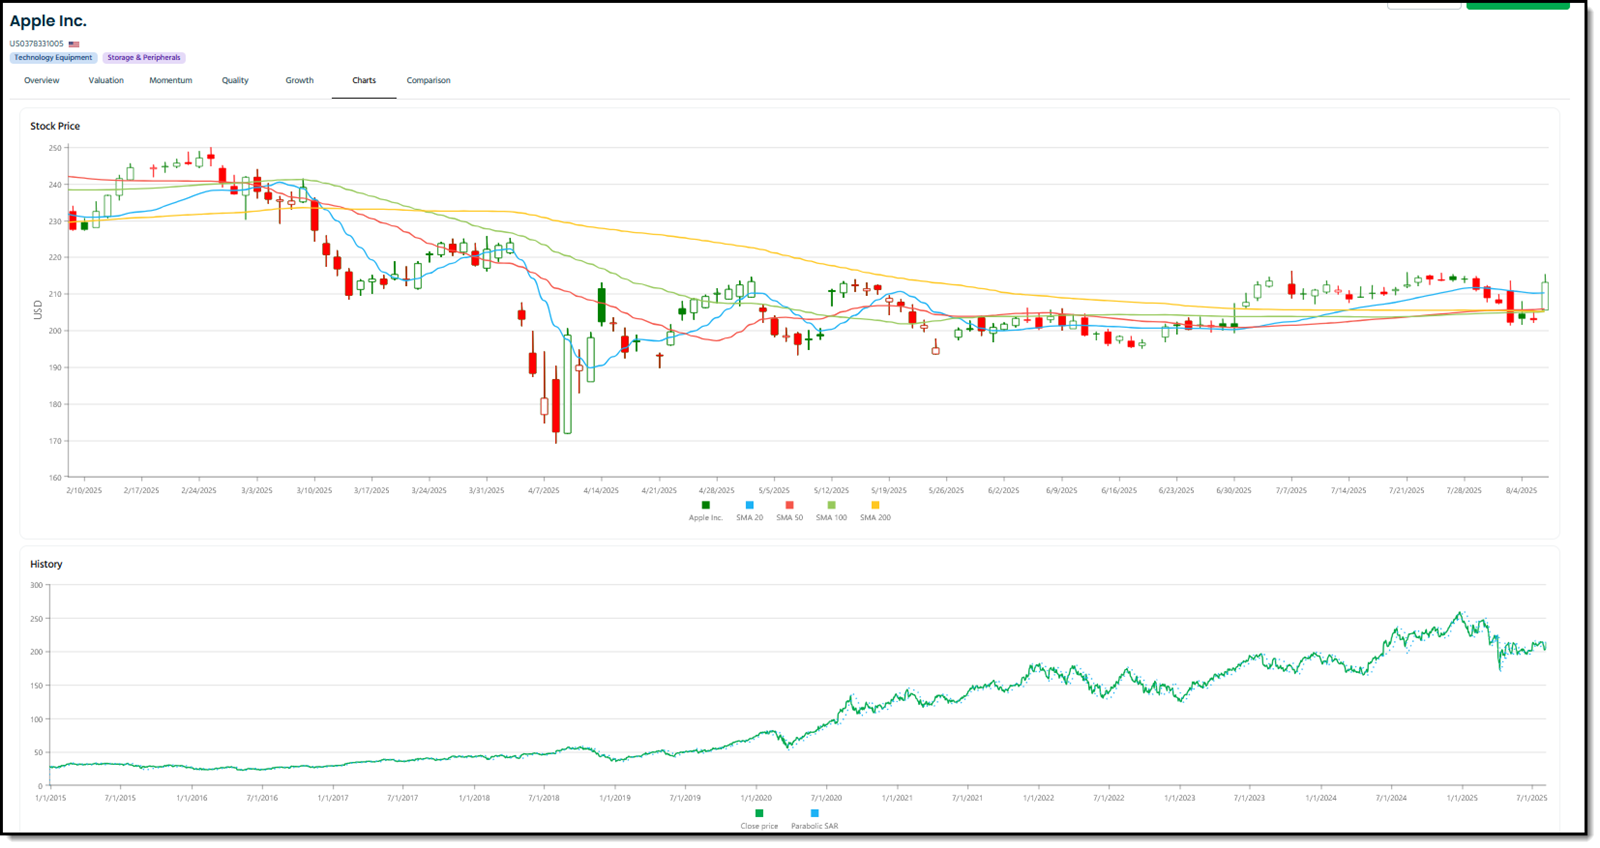
6. Charts Tab
Visual tools to spot trends quickly:
-
1-year candlestick chart
-
10-year price history
-
Parabolic stop and reverse (technical indicator)
Click Image to enlarge
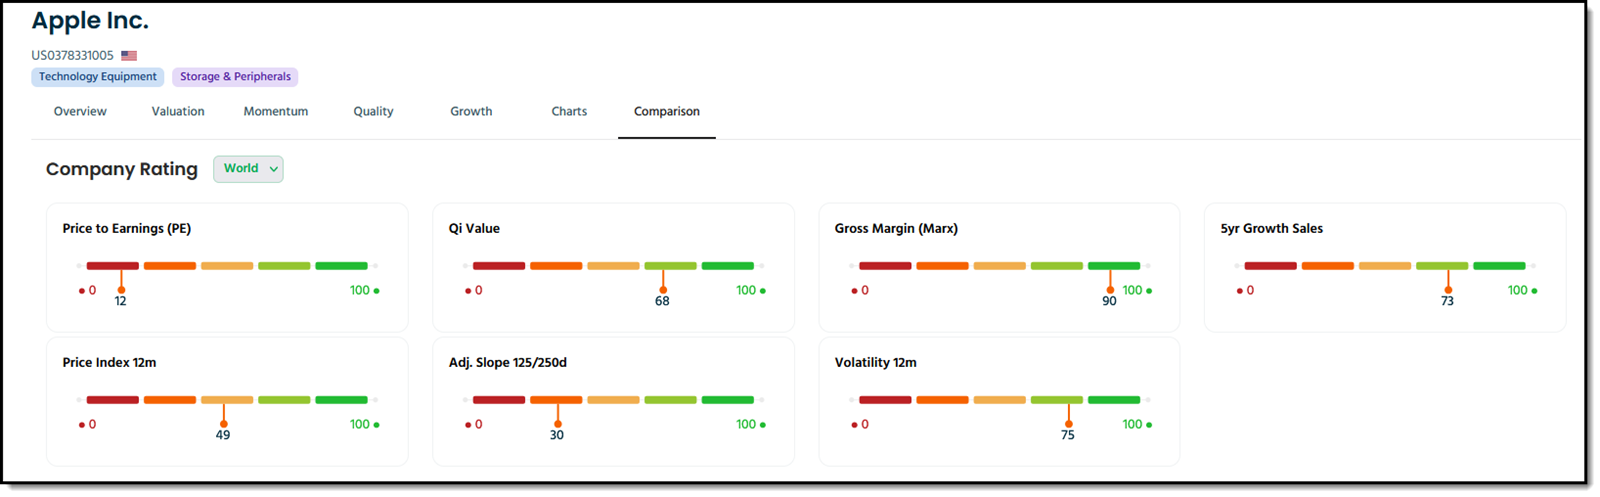
7. Comparison Tab
See how a stock stacks up:
-
Side-by-side with sector, country, and global peers
-
Ranking charts across valuation, quality, and momentum
Click Image to enlarge
Why It Matters to You
This update is not just a design improvement it helps you make better decisions. You can now go from screener idea to full company analysis in minutes.
It is part of our mission: helping you invest with confidence by using proven, data-driven strategies. No guesswork. No hype. Just insights that work.
We built this dashboard for investors like us - detail-oriented, independent, and tired of half-baked tools that hide more than they reveal.
"Our users manage serious portfolios. They need clarity, speed, and depth. This upgrade delivers all three." - Tim du Toit
Try It Today
If you are already a subscriber, the new dashboard is live in your account.
If not, get access through our free 30-day demo at QuantInvesting.com, which includes the screener, backtester, and our top strategies.
Built by investors, for investors. Quant Investing helps you make smart, systematic decisions - no matter the market.
FREQUENTLY ASKED QUESTIONS
1. How will the new dashboard actually save me time?
You no longer need to open multiple websites or spreadsheets to check a stock. All the data - over 110 ratios, charts, and comparisons - is in one place. You can go from an idea in the screener to a full company review in minutes instead of hours.
2. I am not a “numbers” person. Can I still use it effectively?
Yes. The dashboard is split into seven clear tabs, each with visual charts and easy-to-read metrics. You can focus only on what matters for your style - value, momentum, dividends, or quality - without getting lost in data you do not need.
3. What is the Qi Value score, and why should I care?
The Qi Value score is our key valuation metric. It combines multiple proven ratios into a single number so you can see instantly if a stock is cheap or expensive. It saves you from calculating and comparing dozens of separate figures yourself.
4. How do I know if a company is financially healthy?
Use the Quality tab. It has over 20 ratios that measure strength and reliability, including the Piotroski F-Score, Altman Z-Score, and Debt-to-Equity. These are research-backed indicators that help you avoid weak companies before they hurt your portfolio.
5. Can I use it to compare a stock to its peers?
Yes. The Comparison tab lets you see how a stock ranks against others in its sector, country, or globally. You can instantly spot if your company is a leader or laggard in valuation, quality, or momentum.
6. How can I track growth over time, not just one year?
The Growth tab shows both 1-year and 5-year growth in earnings, sales, cash flow, and more. This helps you see if the company is steadily improving or just having a short-term spike.
7. Will this help me avoid emotional decisions?
Absolutely. By having all the facts in one place - updated daily - you can make data-driven choices instead of reacting to news headlines or market noise. This is a big step toward becoming a more disciplined, confident investor.
