

We have said this for a while (2018, 2019), but it is true. If you look at 2020 returns of the 19 investment strategies we track, you can only come to one conclusion - the markets are messed up!
With messed up I mean if you look at the performance of nearly all strategies in Europe you will see what has worked in the past (over decades in up and down markets) just did not work in 2020.
And I am not just talking about value investing not working, quality and momentum also did not work.
What REALLY worked great is if you invested in overvalued bad quality companies!
What investment strategies worked in Europe in 2020?
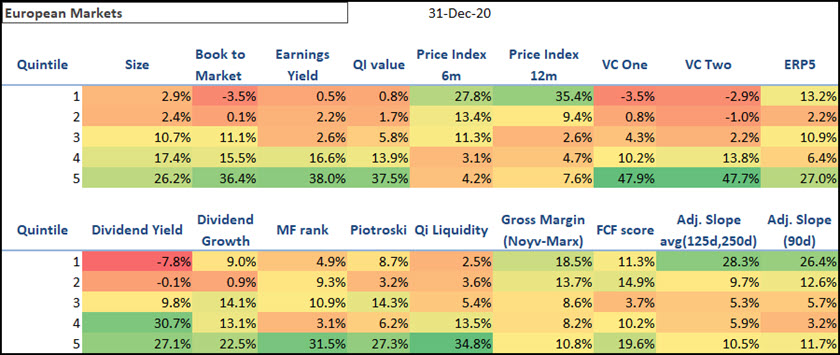
So, what worked best in Europe in 2020?
Here is a short summary:
- Buying companies with the highest Value Composite One value (overvalued companies) would have given you the best return of +47.9%
- Bad Value Composite Two companies (with the worst – most overvalued Value Composite One ranking) also performed well up +47.7%
- Low Earnings Yield (EBIT/EV) companies (expensive companies) also performed well and was up +38.0%
- Buying High Dividend Yield companies was the worse strategy losing -7.8% in 2020. Most likely because dividends were cut everywhere to preserve cash. Just think of the major oil companies cutting their high dividends shortly after oil prices collapsed.
What strategies we tested – on 2,557 companies in Europe
We looked at the performance of the following 19 investment strategies from 1 January 2020 to 31 December 2020:
- Large vs small companies (Quintile 1 = Biggest companies)
- Book to Market value (inverse of price to book)
- Earnings yield (EBIT/EV)
- Qi Value – the strategy I use in my own portfolio
- Price Index 6m (Current price / Price 6 months ago) also known as 6 months Momentum
- Price Index 12m (Current price / Price 12 months ago) also known as 12 months momentum
- VC One also known as Value Composite One rank
- VC Two known as Value Composite Two rank (Value Composite One with an additional ratio: Shareholder Yield)
- ERP5 ranking (Ranking based on Price to Book, Earnings Yield, Return on invested capital (ROIC), 5-year average ROIC)
- Shareholders Yield (Dividend yield + Percentage of Shares Repurchased)
- Dividend Yield
- Dividend growth 5 years (The geometric average dividend per share growth rate over the past 5 years)
- MF Rank (Magic Formula Ranking developed by Joel Greenblatt)
- Piotroski F-Score
- Qi Liquidity ranking (Adjusted Profits / Yearly trading value)
- Gross Margin Novy-Marx (gross profits / total assets) – the best quality ratio we have tested
- Free Cash Flow (FCF) Score (Calculated by combining Free cash flow growth with free cash flow stability)
- Adjusted slope average (125-day, 250 day) – momentum
- Adjusted slope (90 days) – momentum
Only companies worth more than €50 million trading more than €25,000 per day
We excluded companies with a market value less than €50 million and a median 30-day trading value less than €25,000.
This left a universe of around 2,557 companies which means each quintile of the All Developed Markets back test consisted of about 500 companies.
This large number of companies is good because it makes it unlikely that any one company impact the return of any quintile.
Markets worldwide then regions
The following European stock markets were included:
- All the Eurozone countries
- United Kingdom
- Switzerland
- Norway
- Denmark
- Sweden
All companies in five groups – Quintile 1 the best
To test each of the strategies, using point in time data (so no look ahead bias), on 1 January 2020 we divided all the companies in the universe into five 20% groups or quintiles.
Quintile 1 shows the companies that scored best in for all the strategies we tested - Quintile 5 the worst.
For example, Quintile 1 shows the return of the 20% of companies with the highest book to market ratio (lowest price to book – cheap companies) at the start of the year.
And Quintile 5 shows the return of companies with the lowest book to market ratio (highest price to book ratio – expensive companies).
For Price Index 6m quintile 1 show companies with the best momentum (biggest share price increase over 6 months) and quintile 5 companies with the biggest price fall in the previous 6 months.
For the Piotroski F Score quintile 1 shows the return of companies with the best Piotroski F-Score (9 or 8) and quintile 5 those with the worse F-Score.
For the Size strategy quintile 1 shows the return of the 20% of companies with the biggest market value and quintile 5 the 20% smallest companies.
Click Here – To get all the tools you need to implement all 19 strategies NOW!
The best investment strategy in Europe in 2020
Below is the performance of all 19 strategies in Europe:
For reference the European STOXX 600 Index lost -4.0%
Click image to enlarge
Best performing strategies in Europe
Source: www.quant-investing.com
How all the best rated companies (Quintile 1) perform?
- Average return Quintile 1 of all strategies: +9.3%
- Maximum return of Quintile 1 strategies: 35.4%
- Minimum return of Quintile 1 strategies: -7.8%
What worked?
These were the best two Quintile 1 strategies:
- Buying the 20% of companies with the biggest 12-month price increase (Price Index 12m) was the best investment strategy in Europe, it gained +35.4%
- Using the Adjusted Slope 125 day / 250-day momentum indicator you would have earned the second highest return in Europe of +28.3%
What did not work
The two worse performing Quintile 1 strategies were:
- If you invested in high dividend yield it would have been the worst strategy you could use as you would have lost -7.8%
- The second worse strategy was investing in companies with the best Value Composite One ranking or low price to book companies. If you used both strategies, you would have lost -3.5% of your portfolio.
Click Here – To get this weekly report and the tools to implement all 19 strategies NOW!
A warning – investment strategy may stop working
Remember just because a strategy did well in 2020 does not mean it will continue to do so. As you can see the same strategy performed well in one region and terribly in another.
Jumping on the best performing strategy is most likely a bad idea - possibly a very bad idea.
In fact, your best strategy may be the worst performing strategy as it may turn around. Just like you I have no clue as to what strategy will work in the future and if someone says he does, he is lying.
If you want to read about the best strategies we have tested click here: Best investment strategies Quant Investing
Wishing you profitable investing for 2021
PS To get this report on a weekly basis as well as the tools to implement all 19 strategies (for less than an inexpensive lunch for two) in your portfolio sign up here.
PPS It is so easy to put things off, why not sign up right now?
Click Here – To get this weekly report and the tools to implement all 19 strategies NOW!
