

You have been told to never miss the market’s best days. But the real danger is staying invested during its worst. This post breaks down a 36-year study of the S&P 500 that shows a simple rule - based on the 200-day simple moving average - can grow your wealth faster, with less risk. You will learn how avoiding deep losses helps more than chasing big gains. This is not market timing. It is smart risk management you can apply today, even with ETFs. If you want steadier growth and fewer sleepless nights, this read is for you.
Estimated Reading time: 6 minutes
The Market’s Best Days Are a Trap: What Investors Really Need to Avoid
You have probably heard this before:
“Do not try to time the market, because missing the best days destroys your returns.”
It sounds logical.
After all, who would want to miss the best days to power your portfolio upwards? But this idea, often repeated by fund salesmen and in the financial media, only tells only half the story. And following it blindly could cost you years of lost compounding.
This post will walk you through the research paper Rethinking Risk Management and the Myth O "Missing the Best Days" that challenges the “best days” myth.
More importantly, it shows you how to reduce risk, protect your portfolio, and still achieve strong long-term returns.
When To Step Back from Risk
The key is not trying to predict the next bull or bear market but learning when to step back from risk. You will see how a simple rule, based on one technical indicator available everywhere, can dramatically improve your investing results - without you needing to forecast anything.
What Was Tested
The research tested whether it is harmful to miss the market’s best days - and if avoiding the worst days might be even more important. Instead of assuming that staying fully invested is always best, the researchers used 35 years of data from 1988 to 2023 to test a rules-based investment strategy.
One Clear Rule
Their model, called the Defender Program, adjusted market exposure based on one clear rule: whether the S&P 500 was above or below its 200-day simple moving average.
This model was then compared to traditional buy-and-hold investing. The test looked at key metrics: total return, volatility, drawdowns, and recovery speed.
The Goal
The goal was simple: find out whether managing downside risk could lead to better long-term results, even if you missed a few strong up days.
Market Scope and Inclusions
This was not a small or short-term study. The researchers tested their strategy on one of the most widely followed benchmarks in the world - the S&P 500. And looked at the period from January 1988 to December 2023, a total of 36 years of real market history.
This period includes bull markets, bear markets, sideways periods, and several “Black Swan” events. The test period included market events like: the Dot-Com crash, the Global Financial Crisis, which saw the S&P 500 fall over 56%, the COVID-19 crash in 2020, which dropped the market over 33% in one month.
This long time frame adds credibility. It ensures the strategy was not just tested in ideal conditions, but in real-world markets filled with uncertainty. Even though the focus was on the U.S. stock market, the lessons apply to every investor, everywhere.
Findings Also Apply if You Use ETFs
This was a simple, mechanical rule applied to a large, diversified index. That makes the findings useful for you - even if you are managing your own retirement account or investing through index funds. If you use index ETFs or mutual funds, this same logic can be applied with very little complexity.
Bias Control and Methodology
Many investing studies fall apart because of something called hindsight bias. That means making decisions with knowledge of what happened later, which no investor has.
This study avoided that trap as it used only price data and real-time signals, specifically the 200-day simple moving average (SMA). This is a rolling average of the past 200 daily prices. It updates each day, using only past data where there cannot be any hindsight bias.
They also used good data sources - Bloomberg and Norgate - to ensure accuracy. And they did not rely on cherry-picked results. They showed full performance data across decades.
Stock Selection Criteria
Unlike stock-picking strategies, this model does not require you to choose individual companies. Instead, it treats the entire S&P 500 as one portfolio.
The rule is simple:
1. If the index is trading above its 200-day simple moving average, you stay invested.
2. If it is below, you move to cash or a safe asset like short-term Treasury bills.
You can apply the same rule using any broad index fund, like SPY (S&P 500 ETF). All you need is price data and a way to calculate the 200-day average. Many free platforms, like Yahoo Finance, let you add this to your chart.
1. When the price closes above the line, you invest.
2. When it drops below, you sell or reduce exposure.
Rebalancing Frequency
This approach does not rebalance on a calendar schedule, like monthly or quarterly. It is event-driven. You only change your investment when the index crosses above or below the 200-day SMA. This reduces trading and keeps you from overreacting.
Think of it like a traffic light - you only act when the signal changes.
To follow this yourself, check the chart once a week (say, every Friday). If the index is below the 200-day line, you step out. When it climbs back above, you step back in.
What Were the Returns
Here is what the data showed: the Defender Program earned an average return of 15.4% per year from 1988 to 2023. Compare that to just 10.0% per year for buy-and-hold investors.
That is a huge gap best shown with the following chart:
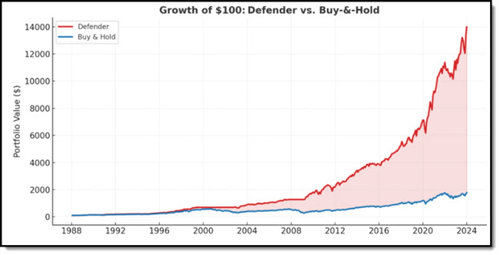
Source: Rethinking Risk Management and the Myth O "Missing the Best Days"
But the real advantage was in risk reduction. The strategy cut volatility by 25%, and its worst drawdown was -22.5%, far less than the -56.8% of the S&P.
This chart shows you by how much the Defender Strategy reduced large drawdowns:
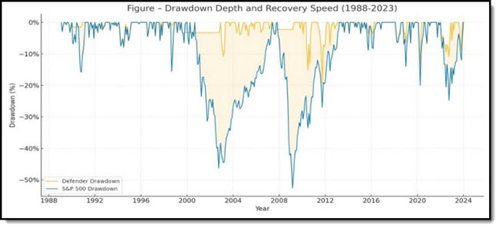
Source: Rethinking Risk Management and the Myth O "Missing the Best Days"
This means your money not only grows faster, but with fewer falls. If you are in retirement or getting close, this can be the difference between peace of mind and panic.
It is not about outperforming in bull markets. It is about staying in the game when others are forced out.
Surprising Findings
One of the biggest surprises?
18 out of the top 20 best days and 19 of the 20 worst losses happened when the market was already in a downtrend, below the 200-day simple moving average line. In other words, the best days often come during bear markets, not healthy uptrends. Chasing those days means taking big risks.
These “best days” are often reflex rallies, after a big fall, not signs of a new bull market. They come after steep drops, when volatility is high. Trying to catch them means you are also exposed to the worst days, which occur around the same time.
This chart shows you where the best and worst days took place:
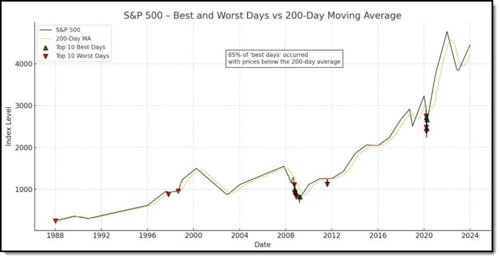
Source: Rethinking Risk Management and the Myth O "Missing the Best Days"
Why You Must Avoid Large Drops
The reason why you must avoid big drops is because of an easy-to-understand term called volatility drag. Volatility drag means that big ups and downs hurt your money more than you think. Imagine you lose 50%, to get back to where you were, you need a gain of 100%. That is because a smaller pile of money needs a bigger return to recover.
So, even if your average return looks okay, your actual results can be much worse if your account keeps swinging wildly. Steady growth is better than wild rides. That is why avoiding big losses helps your money grow faster over time.
The “best days” argument ignores sequence-of-return risk. This means the order and timing of your returns matter as much as their size. Early losses, say just after you invest or when you start retirement, can permanently reduce your capital and limit later gains, while early profits allow your capital to grow from a larger amount.
Buy-and-hold strategies ignore this crucial dynamic.
Conclusion
The message is clear: you do not need to stay fully invested all the time to earn strong returns. In fact, avoiding major losses is more important than capturing every gain. Your real risk is not missing the best days - it is getting caught in a deep drawdown that takes years to recover from.
By using a simple moving average rule, you can protect your capital and stay calm during market storms. You do not need to guess when to get in or out. You just need to respond to what the market is doing, not what you hope it will do. That is the foundation of smarter, safer investing.
Investing your hard-earned money should not be about fear of missing out (FOMO). It must be about maximising the probability of meeting your long-term goals confidently.
Risk management is not trying to time the market. It is investing smarter with data to make the best investment decisions you can.
The following chart shows you just how profitable making smart data-driven decisions can be:
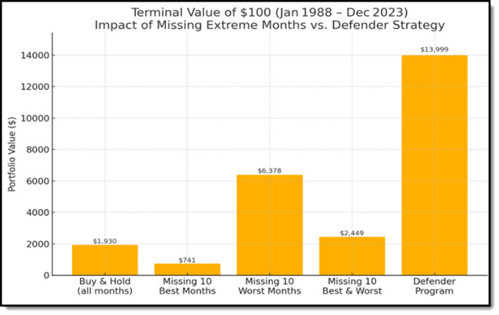
Source: Rethinking Risk Management and the Myth O "Missing the Best Days"
A Rule We Follow in Both Newsletters
This is a rule we have been following in both the Quant Value and the Shareholder Yield investment newsletters.
We stop recommending new investment ideas when the market is below its 200-day simple moving average. We do not sell all investment ideas as we follow a strict 20% trailing stop loss strategy on all individual ideas.
How To Implement This Strategy in Your Portfolio
If you want to reduce your downside risk and sleep better during downturns, start using the 200-day moving average in your own portfolio. You can do this with any ETF like SPY, VTI, or similar.
✅ Step 1: Go to a charting site like Yahoo Finance.
✅ Step 2: Add the 200-day simple moving average (SMA) to your ETF chart.
✅ Step 3: Check once per week.
✅ Step 4: Invest when the price is above the 200-day line. Move to cash or short-term bonds when it is below.
✅ Step 5: Stick to the rule - no emotions, no exceptions.
This simple change could transform your investing results. It is not market timing; it is risk management. And it might be the most important change you make this year.
FREQUENTLY ASKED QUESTIONS
1. What is the 200-day moving average, and why should I care about it?
The 200-day moving average is a simple line that tracks the average closing price of a stock index over the past 200 days. It acts like a guide: when the market is above the line, it often means a healthy trend. When it falls below, danger may be near. Using this line can help you step away from risk when markets are weak and return when strength returns. It is not timing. It is protecting your money.
2. Does missing the “best days” hurt my long-term returns?
Not if you avoid the worst ones too. The research shows that the best and worst days often happen close together and usually during downtrends. Trying to catch the best days often means getting hit by the worst. A better approach is to avoid big drops. That protects your capital and leads to stronger, smoother growth over time.
3. Can I use this strategy with ETFs like SPY?
Yes, absolutely. You can apply the same rule using any index ETF. Just add the 200-day moving average to your chart using a free tool like Yahoo Finance. Check once a week. If the price is above the line, stay invested. If it drops below, move to cash or short-term bonds. It takes minutes to manage and can save you years of recovery.
4. How often do I need to check or rebalance?
Only when the market crosses above or below the 200-day average. That means you act only when the signal changes, like a traffic light. For most investors, checking once a week is enough. This avoids the stress of daily decisions and cuts down on trading.
5. What are the real benefits of using this approach?
You reduce big losses, lower your stress, and grow your money more steadily. The backtest showed that using this simple rule gave higher returns (15.4% per year vs. 10%) with less pain. Smaller drawdowns mean fewer sleepless nights and more consistent progress toward your goals.
6. What if I am close to retirement - does this still work?
Yes, this approach is especially helpful for you. Retirees cannot afford big losses, because early drawdowns can ruin future returns. This strategy helps protect your nest egg by avoiding steep falls, so your savings can last longer and stay on track.
7. Is this market timing? I thought that was dangerous.
No, this is not guessing when to get in or out. You follow one clear rule based on real data, not opinions or predictions. You only react to what the market is already doing. That is smart risk management and not speculation.
