

If you want to avoid investing in companies that manipulate their earnings, this article is for you. It introduces you to the C-Score, an easy-to-use tool developed by investment expert James Montier to detect companies that may be cooking their books.
You will learn the six key warning signs that signal possible financial manipulation and how to calculate a company’s C-Score yourself. The article also shares backtested results proving that companies with bad C-Scores consistently underperform the market, making this a powerful tool for both avoiding bad investments and identifying short-selling opportunities.
Estimated Reading Time: 6 minutes
Cooking the books
In June 2008 James published a very interesting research paper called Cooking the books, or, more sailing under the black flag. In the article he wrote about a C-Score he developed to find companies that were cooking the books.
This is a great indicator you can use to screen out bad quality companies or find companies to short (sell their shares now to profit from buying them back at a lower price in future).
This will bite you in bad times
In the introductory paragraph he wrote:
"In good times, few focus on such ‘mundane’ issues as earnings quality and footnotes. However, this lack of attention to ‘detail’ tends to come back and bite investors in the arse during bad times.
There are notable exceptions to this generalisation.
The short sellers tend to be amongst the most fundamentally driven investors. Indeed, far from being rumour mongers, most short sellers are closer to being the accounting police.
To aid investors in assessing the likelihood of accounting shenanigans, I have designed the C-score.
When combined with measures of overvaluation, this score is particularly useful at identifying short candidates."
He developed the C-Score to find out how many of six common earnings manipulating tricks a company is using.
Just the start of your process
Before I go any further I'm sure you already know that the development of a score like this should only be the first step to see if a company is really cooking its books. It is simply an indicator you can use to find companies that may be cooking the books.
How is the C-Score calculated?
This is how the C-Score is calculated.
It has six inputs, each designed to identify a part of earnings manipulation:
- A growing difference between net income and cash flow from operations. In general, managements have less flexibility in shaping cash flows than earnings. Earnings contain a large number of highly subjective estimates such as bad debts and pension returns. A growing difference between net income and cash flows may also indicate more aggressive capitalisation of costs.
- Increasing days sales outstanding (DSO). This, of course, signifies that accounts receivable are growing faster than sales. This measure is really aimed at picking up channel stuffing (sending inventory to customers).
- Growing day’s sales of inventory (DSI). Growing inventory is likely to indicate slowing sales, never a good sign.
- Increasing other current assets to revenues. Clever CFOs know that investors often look at DSO and/or DSI, thus they may use this catch-all line item to help hide things they don’t want investors to focus upon.
- Declines in depreciation relative to gross property plant and equipment. To beat the quarterly earnings target, firms can easily alter the estimate of useful asset life.
- High total asset growth. Some firms become serial acquirers and use acquisitions to distort their earnings. High asset growth firms receive a flag in the score.
These six inputs are then simply added together. For example if a company has increasing DSI it receives a score of one.
High is bad (6 = Bad and 0 = Good)
These are then summed across the six inputs to give a final C-Score from 0 (no evidence of earnings manipulation) to 6 (high likelihood of earnings manipulation).
Click here to start using C-Score in your portfolio Now!
Back tested results
James back tested the C-Score to see if it really does have the ability to separate stocks which are likely to underperform. And it worked very well!
The C-Score was tested over the 14 year period from 1993 to 2007 on the US and European markets with portfolios formed in June and held for one year.
US – Bad C-Score did 8% worse than the market
In the US, stocks with high C-scores underperformed the market by around 8% p.a. generating a return of only 1.8% p.a. compared to the 10% p.a. the market returned over the same period.
Europe – Bad C-Score 5% worse than the market
In Europe, high C-score stocks underperform the market by around 5% p.a. compared to the 13% p.a. the market returned over the same period.
Use the C-Score with valuation ratios
In the article James mentioned that the C-Score may be even more valuable if you combine it with a valuation ratio (to identify overvalued companies) as they are more likely to want to cook their books to maintain their “growth” status.
C-Score and price to sales
If you combine the C-Score with a price to sales ratio greater than 2 the value added by the C-Score increases substantially.
US – Bad C-Score 14% worse than the market
In the US this combination resulted in a negative return of 4% p.a. (with the median bad C-Score company losing 6% p.a. and 54% of stocks seeing negative returns).
Europe – Bad C-Score 17% worse than the market
In Europe, the combination of a high C-score and price to sales greater than 2 also generates a negative return of 4% p.a. (median bad C-Score company lost 10% p.a. and 57% of stocks had negative returns).
Click here to start using C-Score in your portfolio Now!
More C-Score back testing
As you as you can imagine we found the article very interesting and we wanted to see if we could duplicate James’ results.
Single factor test – not linear
The following table shows the yearly returns if you only used the C-Score to select investments over a 13 year period.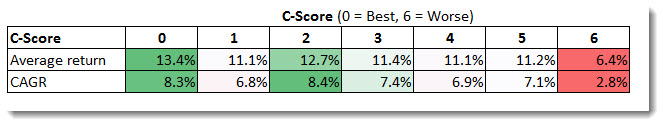
CAGR = Compound annual growth rate
As you can see the returns are not linear from a good to bad C-Score. However the return differences are substantial between the best and worst C-Score as the following table shows:
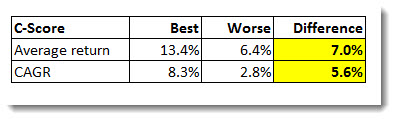
CAGR = Compound annual growth rate
These differences of 7% and 5.6% may not look large but you must remember that these are yearly over a period of 13 years and thus are substantial!
C-Score with EBIT to EV valuation ratio
The same as the back tests James Montier did we tested the C-Score with a valuation measure. As a valuation measure we used earning yield (Earnings before interest and taxes (EBIT) / Enterprise Value).
We divided the bask test into two parts:
- First he tested the returns of the C-Score if you apply it to expensive companies, in other words if it can help you to better select expensive companies to sell short.
- And secondly we applied it to undervalued companies, to see of it can help you to choose better long investments.
C-Score and Overvalued (glamour or growth) companies
The same as you saw in the test above the returns are not linear from a good to worse C-Score. However there is a substantial difference between the companies with a C-Score of 0 (Good) to a C-Score of 6 (Worse).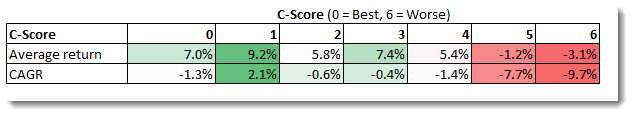
CAGR = Compound annual growth rate
In terms of book cooking, if you classify the best (no book cooking) companies with a C-Score from 0 to 2 and the worse (lots of book cooking) companies with a C-Score from 4 to 6 the following table shows the difference in returns you could have achieved over the 13 year period we tested.
As you can see it is substantial with an average yearly difference over the 13 years of 3% and nearly 3.5%.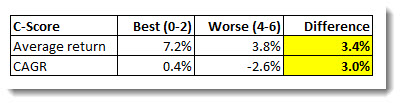
CAGR = Compound annual growth rate
Click here to start using C-Score in your portfolio Now!
C-Score and undervalued (value or unloved) companies
As you know buying only undervalued companies using earning yield (EBIT/EV) is a great investment strategy as you can see from the returns in the table below.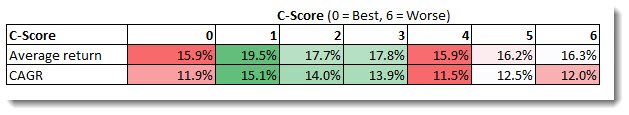
CAGR = Compound annual growth rate
However selecting companies with a good or bad C-Score did not make much of a difference to your returns. In fact the worse C-Score companies did nearly just as well as the best C-Score companies.
Interesting was that companies with a C-Score of 1 (good but not the best) had the best performance over the 13 year period. This may be due to a different number of companies with a 0 and 1 C-Score and is thus the reason why it is better for you to use the Best / Worse classification below.
Good and Bad
If you again classify the best (no book cooking) companies with a C-Score from 0 to 2 and the worse (lots of book cooking) companies with a C-Score from 4 to 6 the following table shows the difference in returns you could have achieved over the 13 year period.
The yearly difference over the 13 years is less compared with overvalued companies.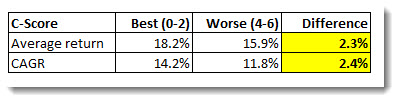
CAGR = Compound annual growth rate
How you can use the C-Score?
Now we get to the part which you are probably most likely interested in. The back tests above clearly show that the C-Score can help your investment returns with good C-Score (C-Score from 0 to 2) companies outperforming bad C-Score companies (C-Score from 4 to 6).
The score however appears to work better when applied to overvalued (glamour or growth) companies, and is thus helpful if you are looking for companies to sell short.
Summary and Conclusion
The simplest rule to apply the C-Score to your investments is to be careful before including companies with a bad C-Score (4 to 6) in your portfolio. However keep in mind that the C-Score is a calculated mechanically by simply adding the values of a few ratios together.
A bad C-Score of course does not means that a company is cooking its books, it simply means that there is a higher probability that it may be and that the financial statements need to be looked at more carefully.
Click here to start using C-Score in your portfolio Now!
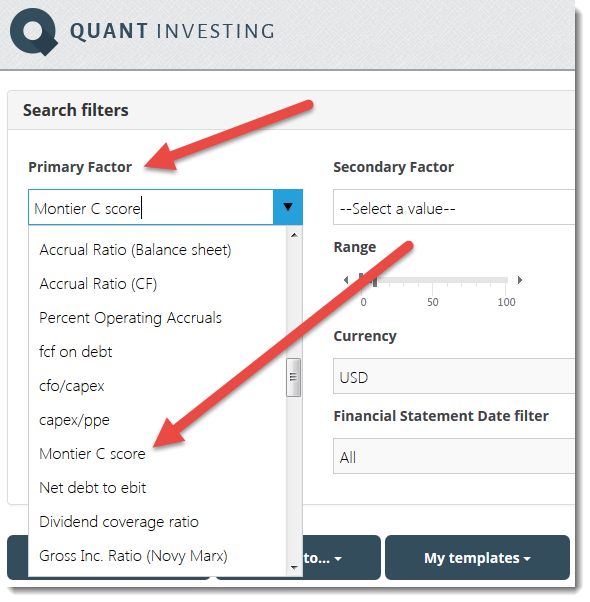
Where to find the C-Score in the stock screener
In the screener you can easily avoid companies with a high Montier C-Score (high chance of book cooking). You simply use one of the four sliders in the screener under the heading Quality select Montier C Score
To cut off all the high C-Score companies move the slider so that you exclude companies with a high C-Score.
Do this by selecting companies from 0% to 80% as shown below.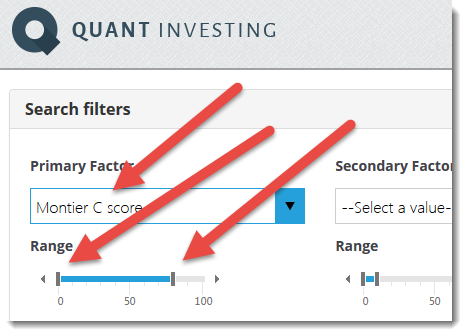
This will exclude all companies with a high chance of book cooking from the universe of companies you apply other criteria to (price to earnings ratio for example)
7 Frequently Asked Questions About the Montier C-Score
1. What exactly is the C-Score, and why should I care?
The C-Score is a tool created by investment expert James Montier to detect companies that may be manipulating their earnings. It helps you avoid bad investments and, if you short stocks, find companies likely to decline. A company with a high C-Score (4-6) has a greater chance of cooking its books, which leads to underperformance or collapse.
2. How do I calculate a company's C-Score?
The C-Score is based on six financial warning signs, including growing differences between earnings and cash flow, rising accounts receivable, and unusual asset growth. Each red flag gets a score of one, and the total C-Score ranges from 0 (good) to 6 (bad). A high score means higher risk of financial manipulation.
3. Does a high C-Score mean the company is definitely fraudulent?
No, a high C-Score does not prove fraud, but it does raise a red flag. It suggests the company may be using aggressive accounting to make its earnings look better than they are. If a company has a high C-Score, you should analyse its financials more closely before investing.
4. How can I use the C-Score in my stock screening process?
You can filter out high-risk companies by excluding stocks with a C-Score of 4 or higher. If you are looking for short-selling opportunities, companies with a high C-Score and a high valuation (Price-to-Sales > 2) are strong candidates. The easiest way to apply this is by using a stock screener that includes the C-Score.
5. What does backtesting say about the C-Score’s effectiveness?
Backtesting from 1993 to 2007 showed that stocks with high C-Scores underperformed the market by:
- 8% per year in the U.S.
- 5% per year in Europe
When combined with valuation ratios, high C-Score stocks performed even worse, making it a reliable tool for avoiding poor investments.
6. Should I sell a stock if I find out it has a bad C-Score?
Not necessarily, but you should dig deeper. A bad C-Score is a warning sign, not an automatic sell signal. Check the company’s financial statements, management quality, and business model before deciding. If other red flags appear, it may be smart to exit or reduce your position.
7. Can I still invest in a company with a high C-Score if it is undervalued?
You can, but the data suggests it does not make much difference. Studies show that in undervalued stocks, the C-Score does not significantly impact returns. However, in overvalued stocks, high C-Scores strongly predict underperformance. If you focus on value investing, other factors like earnings yield (EBIT/EV) may be more useful.
