

Momentum is not a fad. It is a time-tested strategy backed by 150 years of global data. This article breaks down why momentum works, where it works, and how you can best use it in your portfolio.
You will learn how to spot winning stocks by tracking price strength, and how to avoid momentum’s biggest risk - sharp crashes. The research covers seven types of momentum and shows how combining them can boost returns and cut risk.
Most of all, it gives you a simple plan to use price momentum in your own portfolio - no finance degree needed.
Estimated Reading time: 6 minutes
Why Momentum Still Works: 150 Years of Proof and How You Can Use It
You may have heard this before: past winners keep winning, and past losers keep losing. Making money out of this market behaviour is called momentum investing.
A new research paper, “Momentum factor investing: Evidence and evolution”, tested this idea in more ways than ever before, across 159 years, 46 countries, and thousands of portfolios.
The result?
Momentum works. And if you manage your own money, you must use it.
This is what they found, how it works, and how you can apply it to your portfolio.
What Is Price Momentum and How Was It Tested?
Price momentum means buying stocks that have gone up in the past 12 months (excluding the most recent month) and avoiding (or selling short) those that have gone down. They looked at this strategy from every angle. They tested it in the U.S. back to 1866, across developed and emerging markets, and in more than 4,000 portfolios.
In each test, they divided stocks into five groups based on past performance.
- Group 5 had the best performers.
- Group 1 had the worst.
- Then they built a portfolio that bought Group 5 and sold Group 1. This is called a long-short momentum portfolio.
Where Was It Tested?
They tested:
-
U.S. stocks from 1866 to 2024
-
46 countries between 1990 and 2024
-
Large and small companies
-
Portfolios were rebalanced monthly
Micro-caps were excluded from the sorting but included in the portfolios. This ensured results reflected the real-world impact of smaller stocks while avoiding data biases.
They excluded micro-caps when they divided the stocks into groups because they are very volatile. If you used them to define the cut-offs, a few extreme returns could distort the rankings for the rest of the market.
By using only larger, more liquid stocks to set the breakpoints, you get cleaner and more stable momentum groups. They still included micro-caps in the groups afterwards, so their returns are counted, which keeps the results realistic and lets you see how momentum behaves across the full stock market.
What Did They Find?
Momentum worked almost everywhere. In the U.S., strong - weak (5-1 in table below) momentum returned 9.24% per year from 1927 to 2024. Outside the U.S., the same momentum returns averaged 7.57% annually. Returns were stronger in smaller stocks, as you can see in equally weighted portfolios below - the dark green regions.
Even more impressive, it worked across all 31 countries tested. Japan had the weakest results, but still positive. Portugal had the strongest.
So yes. Even after 150 years, momentum still works.
The following table shows you the returns of an momentum investment strategy in the USA over various time periods.
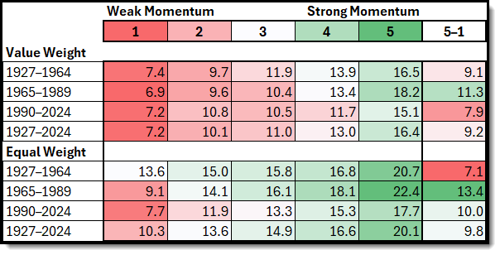
Source: Momentum factor investing: Evidence and evolution
To start finding companies with Strong Momentum NOW! - Click here
What Other Types of Momentum Also Work?
Price is not the only place where momentum shows up. The paper tested six other types:
-
Fundamental momentum: based on earnings surprises or analyst upgrades.
-
You calculate fundamental momentum by using three firm-level signals. First, you measure earnings momentum with standardised unexpected earnings (SUE), which compares actual earnings to expected earnings. Second, you measure analyst momentum using six-month changes in analyst forecasts (REV6). Third, you measure news momentum using firm news sentiment scores. Each month, you sort stocks into five groups based on each signal and track their future returns. You then combine the three signals by averaging their returns to create a single fundamental momentum portfolio.
-
Firm-specific momentum: based on performance after removing market effects
-
You calculate firm-specific momentum by first removing broad market effects from each stock’s returns. You do this by regressing each stock’s returns on the three Fama-French factors: market, size, and value. The leftover part, called the residual return, captures movements unique to the firm. You then add up these residual returns over the past 12 months, skip the most recent month, and rank stocks into five groups. Stocks with high residual momentum are winners, and those with low residual momentum are losers.
-
Anchor-based momentum: how close the price is to the 52-week high
-
You calculate anchor-based momentum by comparing each stock’s current price to its highest price over the past 12 months. First, you compute the price-to-high (PTH) ratio by dividing the stock’s price at the end of last month by its 52-week high. Second, you compute the high-to-price (HTP) ratio by dividing the 52-week high by the stock’s price 12 months ago. Each month, you sort stocks into five groups based on these ratios and track their future returns. You analyse each ratio on its own and also average them to form the anchor-based momentum strategy.
-
Network momentum: based on similar companies or shared analysts
-
You calculate network momentum by looking at how a stock’s connected peers have performed. First, you measure industry momentum by using the past returns of other stocks in the same industry, excluding the stock itself. Next, you measure text-based network momentum by finding the 50 most similar firms based on business descriptions and using their past returns. You also measure analyst network momentum by using the returns of stocks covered by the same analysts. Each month, you sort stocks into five groups based on these network returns and track future performance. You then average these strategies to form a single network momentum measure.
-
Industry momentum: based on peer performance
-
You calculate industry momentum by using returns from a stock’s industry peers. First, you place each stock into one of the Fama-French 49 industries. Then, you compute the value-weighted return of all other stocks in the same industry, leaving out the stock itself. You use the industry’s past returns from the last 12 months, including the most recent month. Each month, you sort stocks into five groups based on their industry momentum and track how these groups perform over time.
-
Factor momentum: using momentum in other strategies, like value or quality
-
You calculate factor momentum by tracking how well common risk factors have performed in the recent past. You use 153 factors from Jensen, Kelly, and Pedersen, which include factors like market, size, value, profitability, investment, momentum, and many others. For each factor, you measure its return over the past 12 months, and you do not skip the most recent month. You then rank the factors from lowest to highest return, place them into five groups, and track their future performance. Factors that performed well tend to keep performing well, which creates factor momentum.
The most powerful version was a combination of all these types. This “multi-dimensional momentum” earned 9.65% per year using equal weighting. It beat regular price momentum on both return and risk.
These other forms of momentum data are not as easy to get hold of or calculate, but the point it makes is clear: once price, sentiment or company fundamentals move in a direction, they continue to do so.
What Are the Risks of Momentum?
Momentum has a weak spot. It can crash. A big one happened in 2009. Momentum portfolios lost over 80% when the market fell due to the financial crisis.
This happens because momentum strategies often get crowded. When the market falls, everyone rushes out of the same stocks at once.
Here’s how you know momentum is risky:
-
High volatility
-
Left-skewed returns (more negative than positive surprises)
-
Large maximum drawdowns (up to -88%)
How Can You Reduce Momentum Risk?
There are three ways to make momentum safer.
1. Use Different Types of Momentum
Not all momentum types crash the same way. The researchers found that firm-specific and fundamental momentum are less sensitive to big reversals. Adding them can lower your overall risk.
2. Combine Momentum Signals
The researchers found that if you build a portfolio that blends price, fundamental, anchor, and network momentum, this combined strategy showed lower volatility and higher Sharpe ratios (risk-adjusted returns).
3. Scale Based on Volatility
Use recent daily price volatility to adjust position sizes. This is called volatility scaling. It avoids big bets when the risk is high. In the study, scaling reduced the max drawdown from -88% to -49%.
How to Do It:
-
Calculate daily return volatility for the past 6 months.
-
Reduce your allocation when volatility increases.
-
Increase it slightly when volatility is low.
This strategy works best when applied to a diversified set of momentum signals.
Why Momentum Still Belongs in Your Portfolio
In spite of the risks, momentum is not a fad. It has worked since the 1800s. It works in bull markets, bear markets, and across different countries and industry sectors. It works in both small and large companies.
Even more important, it works because of human behaviour. Investors overreact to bad news and under react to good news. This delay creates trends that continue. Momentum takes advantage of that.
But you must manage the risk to get its full benefit.
To start finding companies with Strong Momentum NOW! - Click here
How You Can Apply This Momentum Strategy
You can do this step-by-step, without a finance degree.
A lot of the non-price-based momentum indicators are hard to find and calculate, or are only available to big funds that can afford them. That said, you can get most of the benefit from momentum by using good price-based momentum indicators.
The Quant investing stock screener has momentum indicators that range from one month to 5 years, including the following:
Price Index 12m Minus 1m (used in the research study).
Calculated as Share price 1 month ago / Share price 12 months ago.
The Momentum Composite Indicator
It is designed to help you find stocks with positive momentum, AND low volatility and does this by combining three momentum and one volatility ratio into one easy-to-use indicator.
Momentum Composite Indicator is calculated as follows:
Step #1
Firstly, all the companies in the screener database are ranked individually by the following four indicators:
- Price Index 3m, (Three-month price momentum) - Higher is better
- Price Index 6m, (Six-month price momentum) - Higher is better
- Price Index 9m (Nine-month price momentum) - Higher is better
- Volatility 12m (Twelve-month price volatility) - Lower is better
Step #2
Secondly, the four rankings are combined into a single number for each company.
Step #3
Thirdly, the combined ranking is then recalibrated to ensure that the 1% top-ranked companies (best) receive a value of 1, the next 1% a value of 2, and so on, up to the 1% worst-ranked companies, which receive a value of 100.
This process results in a composite momentum value for each company in the screener, ranging from 1 (best) to 100 (worst).
How To Implement a Pure Momentum Strategy
Steps to implement the strategy:
1. Log into the screener
2. Select the momentum indicator you would like to use as a Primary factor to screen with
3. Select the countries, industry sectors, minimum daily traded value and minimum market value
4. Run the screen
5. Sort the results from best to worst by your momentum value of choice.
6. Invest in the companies with the best momentum. We suggest a minimum portfolio size of 50 companies so that your returns reflect that of the strategy and not any specific company.
Conclusion
Momentum is one of the strongest, most tested strategies in investing. It performs great, but it is not magic. It comes with risks. When you understand those risks and use the right tools, momentum can become a high-return core part of your investment strategy.
If you are managing your own money, now is the time to act. Start small. Be consistent. Let the data guide you. Remember, winners keep winning for a reason. Let momentum work for you. Long-term backtests say it will.
To start finding companies with Strong Momentum NOW! - Click here
FREQUENTLY ASKED QUESTIONS
1. What is momentum investing, and why should I care?
Momentum investing means buying stocks that have gone up and avoiding ones that have fallen. It works because strong stocks often keep rising. This happens because investors are slow to react to good news. The research shows that momentum has worked for over 150 years, in 46 countries, and in both large and small stocks. If you invest your own money, momentum can give your portfolio a powerful edge.
2. Does momentum still work today - or is it just history?
Yes, momentum still works. In the U.S., long-short momentum returned 9.24% a year from 1927 to 2024. Globally, it earned 7.57% a year. It worked in all 31 countries tested - even in Japan, where returns were lower. The most recent data still shows it beating the market. So this is not just theory. It is real and repeatable.
3. What is the easiest way to use momentum in my portfolio?
The simplest way is to use price momentum. Focus on stocks that have gone up over the past 12 months, but skip the most recent month. You can do this using the “Price Index 12m Minus 1m” indicator in the Quant Investing screener. Sort by this value and invest in the top 50 stocks. This gives you the full benefit of the research-backed strategy without needing to be a professional.
4. Are there different types of momentum? And are they better?
Yes. Price momentum is just one type. The study also tested momentum in company earnings, news, analyst ratings, industry peers, and even how stocks are linked. When you combine them all - called “multi-dimensional momentum” - the results were even better. This combined long-short momentum strategy earned 9.65% per year with less risk. It is harder to build, but it shows that trends exist in many places.
5. What are the risks of momentum investing?
Momentum can crash hard when markets turn fast. The worst crash happened in 2009, with an 80% drop. Momentum also has higher volatility and big drawdowns. This is because too many investors may crowd into the same stocks, and when they rush out, prices fall fast. You must know this risk going in.
6. How can I reduce the risk of a momentum crash?
There are three smart ways:
-
Mix price momentum with other types like earnings and network momentum.
-
Use a combined momentum score to smooth out big swings.
-
Adjust how much you invest based on recent price volatility. This is called volatility scaling. It cuts losses during rough times. For example, in the study, scaling lowered the max loss from -88% to -49%.
7. Is this something I can really do without a finance degree?
Absolutely. The key idea - buy what has gone up - is simple. Tools like the Quant Investing screener make it even easier. You can filter by momentum, sort results, and build a diversified list. You do not need to be perfect. Just stay consistent, spread your bets, and let the data do the work. Momentum is one of the few strategies backed by 150 years of proof. You can use it too.
To start finding companies with Strong Momentum NOW! - Click here
