

Price Index 12m Minus 1m = Share price 1 month ago / Share price 12 months ago.
For example
Current date is 1 October 2016
Price Index 12m Minus 1m = Share price on 1 September 2016 / Share price on 1 October 2015.
The ratio shows you the return of a share price over the past year but excluding the last month.
What to use it for
This ratio is useful to screen out companies with a large jump in share price over the past month. Studies have shown that a large increase in price over a short period (like a month) usually reverses shortly thereafter.
A value greater than 1 shows that there's been a price increase over the period whereas a value less than 1 shows that there has been a price decrease.
Available as a slider and output column
The ratio is available as an item in the slider as well as an output column in the screener.
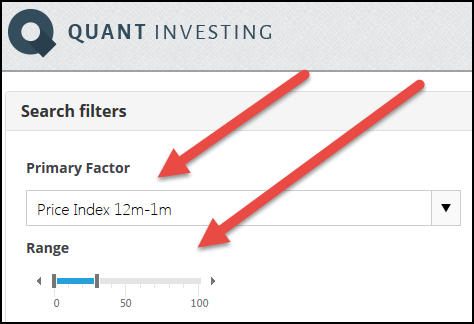
This means you can select 12m minus 1m momentum and refine your search with the slider as shown below:
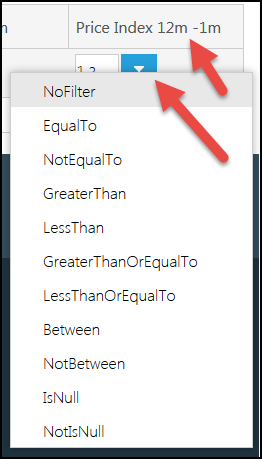
Or you can refine your search by sorting the values in the column (simply click the column heading) or by typing a value in the space below the heading and clicking the small funnel icon as shown in the screenshot below.
How to select the highest Price Index 12m Minus 1m companies
To find companies with the highest Price Index 12m Minus 1m momentum set the slider from 0% to 10%.
Click here to start using 12-1 month momentum in your portfolio Now!