

Joel Greenblatt's Magic Formula averaged 33% per year over 16 years.
Combined with momentum in European markets, the strategy returned +783% over 12 years - compared to 30.5% for the market.
Here is what the research shows, including the most recent 2016–2025 back test updated to include 2025 results.
Related Reading
Magic Formula Investing Pitfalls to Dodge
What The Magic Formula Does for You - Quality at an Attractive Price
As you know the Magic Formula investment strategy was developed by Joel Greenblatt and described in his excellent book called The Little Book that Still Beats the Market.
It is also the book that got me started with quantitative investing in 2006.
The Magic Formula gives you a simple, reliable way to find great businesses at great prices. It’s built on two timeless truths about investing:
- Quality matters: Companies that earn high profits on the money they invest are usually strong and well-run.
- Price matters: Even the best companies can be great investments only when their stock is cheap.
The Magic Formula combines these two ideas into a system that has worked for years—and in markets all around the world. It does this by looking for companies with a high earnings yield (companies that are undervalued) and a high return on invested capital (ROIC) (quality companies).
The formula then ranks companies on ROIC (where 1 is the company with the highest ROIC), and by earnings yield (where 1 is the company with the highest earnings yield).
To get the Magic Formula rank the ROIC rank and earnings yield rankings are added together. The best Magic formula company has the lowest Magic Formula rank (the lower the better).
Magic Formula and Momentum Investment Strategy in Europe - 2016 to 2025
This is the most up to date backtest, the one we update yearly.
It is the results of a back test of the Magic Formula combined with momentum (Price Index 6 months) investment strategy in Europe over the nine year period from January 2016 to December 2025.
It is an update of this back test Magic Formula investing & Price Index 6m momentum investment strategy which covers the 12-year period from 13 June 1999 to 13 June 2011.
How the companies were selected
Here are the exact details of the back tested investment strategy:
- Countries - 17 Eurozone countries (Austria, Belgium, Cyprus, Estonia, Finland, France, Germany, Greece, Ireland, Italy, Luxembourg, Malta, the Netherlands, Portugal, Slovakia, Slovenia, and Spain)
- Exclude banks, insurance companies, investment funds, certain holdings companies, and REITS
- Exclude companies with an average 30-day trading volume of less than €10,000
- Portfolios formed on the first trading day of the year (Because the back test database is point in time there is not risk of look-ahead bias)
- Returns were compounded on an annual basis
- Select the 20% best ranked Magic Formula companies
- Sort the list by Price Index 6 months from high to low
- Buy the top 50 companies by Price Index 6 months on an equal weight basis
- Rebalance after one year
Magic Formula and Momentum investment strategy performance
Here are the summarised results:

Source: Quant Investing Historical Stock Screener (back test function)
As you can see the strategy performed worse than the market in 2018, 2019, 2022 to 2024 but performed great in all other periods to still beat the benchmark EURO STOXX® Index overall and on a CAGR basis +10.7% compared to +9.5%.
2025 was a great year for the strategy after two bad years which may have lead to followers of the strategy to start doubting it which is completely understandable. But it bounced back in 2025!
If you had doubts about the strategy remember what Joel said:
Underperformance is normal, but as investors abandon the strategy the companies it recommends become more attractive leading to outperformance again.
This again shows you how important it is to:
- FIRST find an investment strategy you are comfortable with and
- SECOND stick to that strategy when it underperforms, even over a few years as happened here in 2018 and 2019.
As you may already have guessed, the formula does not always work, as mentioned and explained by this investor. You know, this happens to all investment strategies.
Screen for Magic Formula stocks yourself — free for 30 days
The Quant Investing screener ranks thousands of European, US and Asian stocks by earnings yield and return on capital — exactly as Greenblatt describes. You can run the screen, sort the results, and see which companies rank highest right now.
Your free 30-day trial includes full screener access, the historical back tester, a free copy of What Works on European Markets (74 pages), and our Best Ideas Newsletter. No credit card. Cancels automatically after 30 days.
Run the Magic Formula screen free for 30 days
No credit card needed. Cancels automatically after 30 days.
Older Backtests of the Magic Formula
#1 Returns From Joel's Book
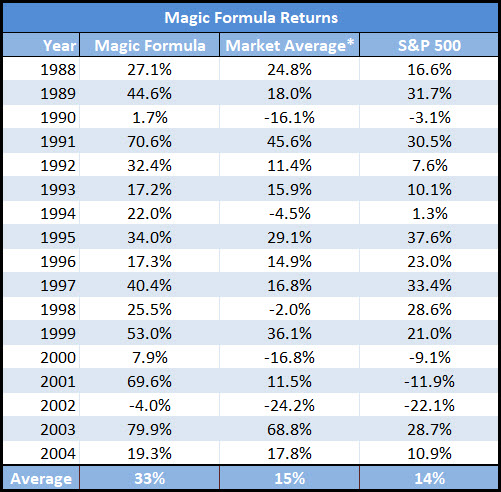
This was the original returns from a Magic Formula investment strategy as shown in the book The Little Book That Still Beats the Market:
Click to enlarge
Source: The Little Book That Still Beats the Market 2006
*Market Average return was the return of an equally weighted index of the 3,500-stock universe Joel used when testing the Magic Formula.
When Joel Greenblatt introduced the Magic Formula, he revealed something remarkable: this strategy averaged a 33% return per year over 16 years. That’s more than double the market’s return!
These results weren’t a fluke. They reflected a core truth about investing—focusing on quality and value works. The Magic Formula wasn’t just a method; it became a compass for investors, pointing the way to long-term wealth.
#2 Magic Formula Investing Works Outside the USA
Does the Magic Formula work outside the U.S.? It does—and that’s part of what makes it so powerful. This strategy taps into universal principles that work across borders and in different market conditions.
That is what we wanted to know. So we tested the strategy in Europe over the 12 year period from June 1999 to June 2011.
This is what we found:
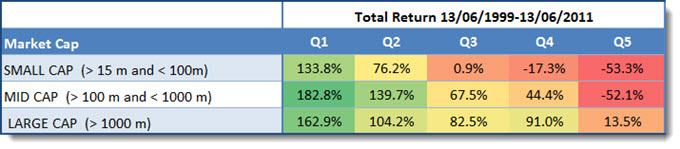
Magic Formula returns in Europe from June 1999 to June 2011 by company size.
Source: Quantitative Value Investing in Europe: What works for achieving alpha
The results in Europe were clear: the best-ranked Magic Formula companies (Q1) outperformed those with worse rankings (Q5). This was true for small, medium, and large companies.
No matter where you invest, the Magic Formula’s core ideas—quality and value—help you find opportunities others overlook. That’s what makes it a timeless strategy.
Magic Formula did substantially better than the market - up to 152.3% better
The best ranked Magic Formula investing companies all substantially outperformed the market which returned only 30.54% over the same 12 year period.
But, you can improve the returns of the Magic Formula for returns up to 783.3%
We also tested the Magic Formula investing strategy with 13 other ratios and as you can see in the table below the returns of the strategy can be improved a LOT!
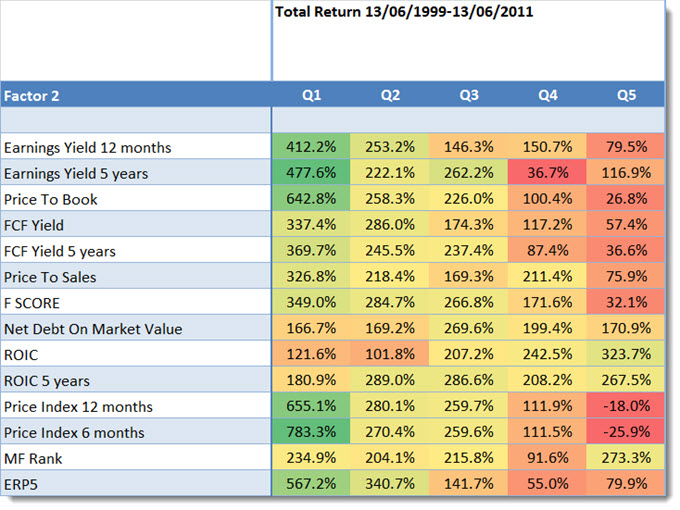
Magic Formula returns when combined with a third ratio in Europe from June 1999 to June 2011.
Source: Quantitative Value Investing in Europe: What works for achieving alpha
Look at the returns in column Q1, it shows the returns generated by first selecting the 20% best Magic Formula investing companies and then selecting only those companies that were best rated with the ratios in the column called Factor 2.
Best combination +783% was Momentum (600.5% improvement)
This means you could have earned the highest return of 783.3% over the 12 year period if you invested in the best ranked Magic Formula companies that also had the highest 6 month price index (share price momentum).
This is a 600.5% improvement over the best return of 182.8% you could have earned if you used only the Magic Formula to get investment ideas.
#3 The Magic Formula Works in Finland
Does the Magic Formula work in smaller markets, like Finland? Yes, and the results are a reminder of why this strategy has stood the test of time.
This was proved in 2013 by Topias Kukkasniemi in his 68 page master’s thesis The Use of Systematic Value Strategies in Separating The Winners From The Losers: Evidence From The Finnish Markets at the Lappeenranta University of Technology in Finland.
Topias tested the Magic Formula on the Finnish stock market over the 13 year period from May 1997 to May 2010 and found that it does outperform the market.
Testing the Magic Formula in Finland
Topias tested the Magic Formula slightly differently. Instead of using Return on Invested capital (ROIC) he used Return on Assets (ROA).
He did this for two reasons:
- Because the previous research on the relationship between ROA and high future returns is extensive.
- ROA figures are more easily accessible by small investors than ROIC.
ROA was calculated as follows: Earnings Before Interest and Taxes (EBIT) / Total Assets.
Test portfolios, a great idea
To test the strategies really thoroughly Topias divided companies into four categories (from best – Top 25% to worse – Bottom 25%) based on their Magic Formula rankings.
This resulted in the following portfolios:
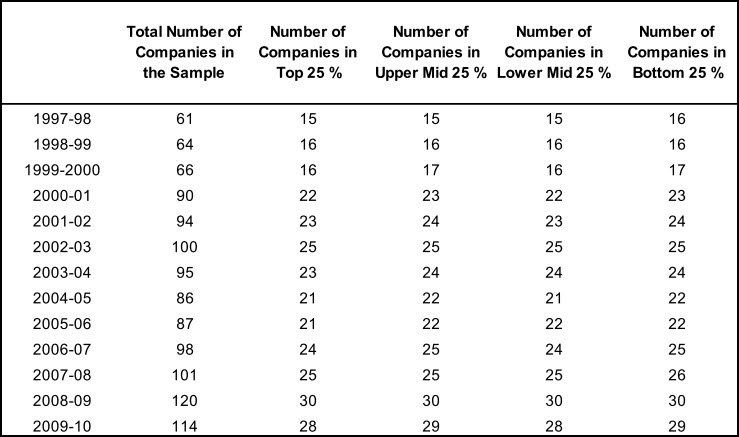
As you can see the total number of companies in the investment universe each year varied between 61 and 120. This resulted in the number of companies in the portfolios varying between 15 and 30.
Results
Now we come to the most important part – how well did the Magic Formula do in Finland?
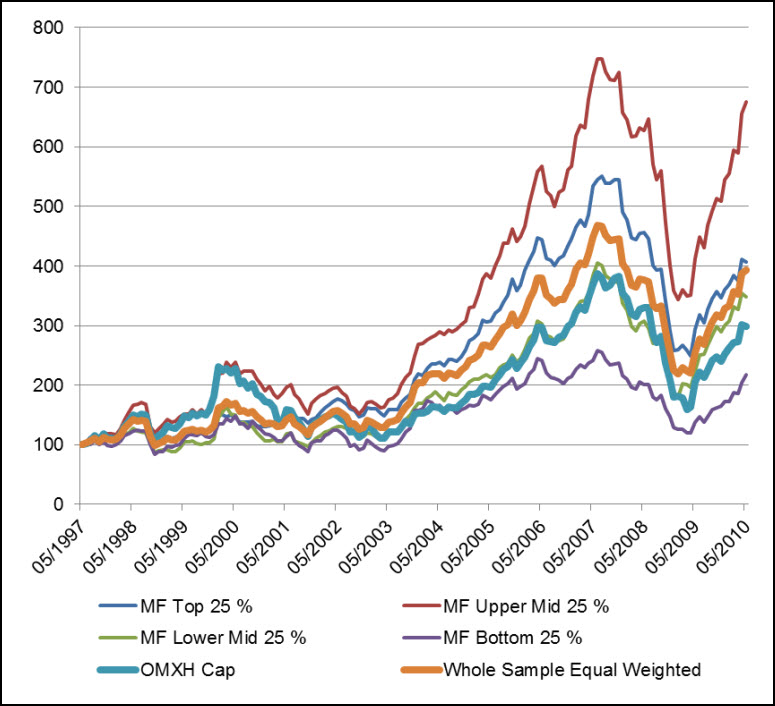
Click to enlarge image
As you can see the Magic Formula could definitely have helped you outperform the market.
Surprising finding!
But the surprising finding of the study is that the best ranked Magic Formula companies (MF Top 25%), thin blue line in chart above, did not perform the best.
You would have gotten better returns if you invested in the companies just below the top 25% of Magic Formula companies (MF Upper Mid 25%) the red line in the chart above.
Why is this, you may be thinking?
Topias speculated as to why it could be saying:
"A possible explanation for this could be that the stocks ranked in the top quartile are cheap for a reason and have only recently taken a turn to the worse so that the accounting ratios still look attractive although the business environment has changed. For some reason, Magic Formula seems to put the biggest gainers in the second 25% of companies."
Conclusion
So the Magic Formula works even if you apply it to a relatively small group of companies only in Finland.
When investing using the Magic Formula it is not the best idea to choose the highest ranked companies but the companies ranked from 26% to 50%.
Run the Magic Formula screen free for 30 days
No credit card needed. Cancels automatically after 30 days.
"I looked into using Refinitiv's Eikon for around $5k a year until I discovered your service."
Ron — Financial Advisor, USA
#4 The Magic Formula Works in Belgium, Luxembourg and the Netherlands
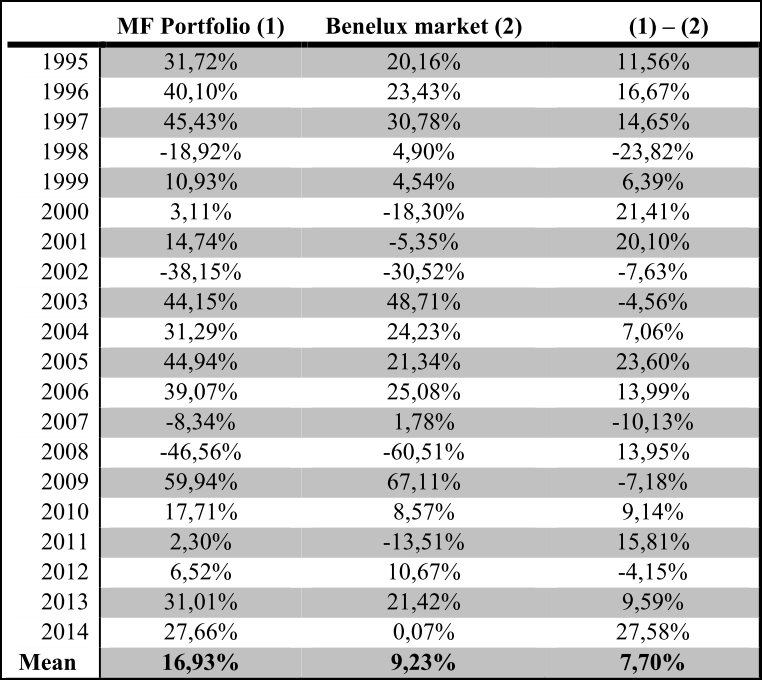
The Magic Formula investment strategy also works if you apply it to companies in Belgium, Luxembourg and the Netherlands as proved by Pim Postma in his 2015 Bachelor thesis Magic Formula Investing in the Benelux.
Here is the abstract of Pim’s thesis:
“Joel Greenblatt’s Magic Formula trading strategy was able to generate market beating returns without taking additional risk in the United States stock market during the period of 1988 until 2004, and therefore clearly violates the Efficient Market Hypothesis.
This strategy is a simple stock selection method where Return on Invested Capital and Earnings Yield are the key metrics for determining the best common stock investments.
This paper takes this specific Magic Formula trading strategy to the Benelux stock market and performs a back test to see whether this strategy also shows market outperformance in the Benelux stock market.
The answer to this question is clearly a yes.
The Magic Formula trading strategy was able to realize an average 7,70% annual market premium in the Benelux stock market without taking additional risk during 1995 until 2014. This signalizes a market anomaly and also violates the Efficient Market Hypothesis.”
Yes the Magic Formula works
The abstract is just a fancy academic way of saying that from 1995 to 2014 the Magic Formula definitely worked in Belgium, Luxembourg and the Netherlands as it would have given you an average yearly return of 7.7% better than the market over the 20 year test period.
I am sure you will agree it’s an impressive market beating return.
Invested in 10 companies each year
Because the Benelux company universe was so much smaller than the US universe Joel Greenblatt tested in his book a portfolio of only 10 equal weight positions was formed.
Thus year on 31 March a portfolio of the top 10 Magic Formula companies were bought.
This portfolio of 10 companies were rebalanced on 31 March each year because most European companies have 31 December year ends and as of 31 March most of the year-end financial statements will already have been published and he could calculate Magic Formula components for each company.
Returns of the Magic Formula
Now for the most important part, just how did the Magic Formula perform?
Click to enlarge image
As you can see the Magic Formula performed very well.
If over the 20 year period from 1995 to 2014 you bought the 10 best Magic Formula companies each year you would have outperformed the market by 7.7% per year.
Performance better than most fund managers
And over the 20 years you would have done better than the market 70% of the time. This is better than most fund managers who underperform the market 80% of the time.
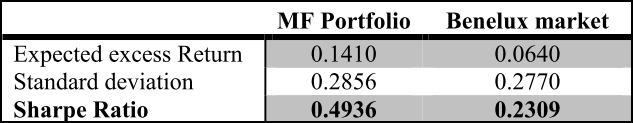
Better risk adjusted return
Not only did you outperform the market, the higher returns you generated would have more than compensated you for the higher volatility of the Magic Formula portfolio which only had 10 investments compared to the market portfolio which had more than 200 companies.
As you can see the table below the Magic Formula portfolio had a substantially higher risk adjusted return or Sharpe Ratio (higher is better) which means you were very well compensated for the higher ups and downs (volatility) of the Magic Formula strategy.
Just how much better did the Magic Formula perform?
How much better would you have done if you used the Magic Formula?
The following chart shows this very clearly.
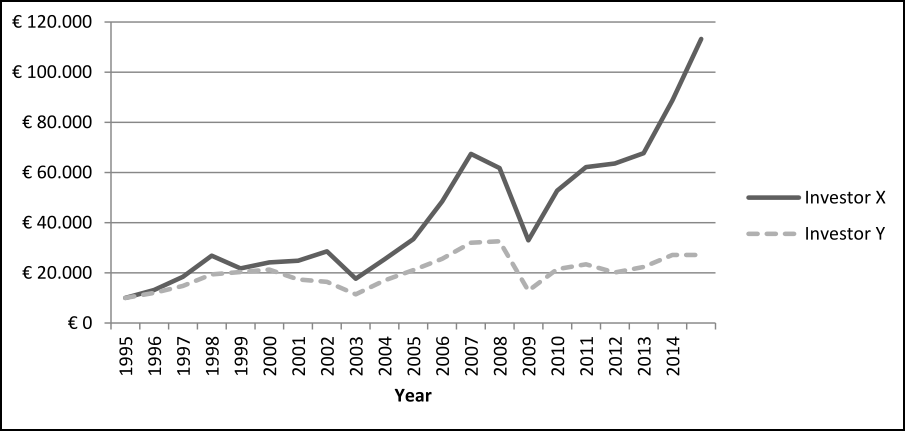
Click to enlarge image
Magic Formula gave you 11.3 times your capital
Investor X invested €10,000 in March 1995 using the Magic Formula and at the end of the 20 year period had €113,238 in his investment account. This is 11.3 times the amount he or she started with.
Market portfolio only gave you 2.7 times your capital
Investor Y also started with an initial investment of €10,000 but invested in the Benelux market index and at the end of 20 years had only €27,182 in his investment account, only 2.7 times his or her starting amount.
Conclusion
This research study clearly shows that the Magic Formula investment strategy also works outside the USA as it substantially outperformed the Benelux (Belgium, Luxembourg and the Netherlands) stock markets.
Run the Magic Formula screen free for 30 days
No credit card needed. Cancels automatically after 30 days.
"When I started using the Quant Investing screener it saved me a LOT of time and work. I used to spend several days analysing balance sheets and making the ratios to filter the stocks I wanted. Now it's done in seconds."
Enrique — Spain
#5 Average Magic Formula vs. Last 12 Months
In December 2011 Alpha Architect published interesting research report called Magic Score: Long-Term vs. Short-Term.
They wanted to see if the long term Magic Formula performed better than a Magic Formula calculated using values from the past 12 months.
The long term Magic Formula
They calculated the long term Magic Formula as follows:
- Valuation = 8-year average earnings before interest and taxes (EBIT)) to total enterprise value (TEV)
- Quality = 8-year average EBIT to net property plant and equipment (NPPE) plus net working capital
The long term Magic Formula is thus just the same as the trailing twelve months version, except that the valuation ratio includes a long term average of EBIT divided by the current enterprise value. And the quality variable is the average past 8-year EBIT/ current equity.
How they did it:
- Calculate the returns for the standard Magic Formula
- Calculate the returns for the long-term Magic Formula
- They excluded the bottom 10% market value companies on the NYSE
- They only included liquid companies with an average daily traded value of more than $1.5mm (adjusted by CPI)
- Test period 38 years from 1972 to 2010.
- LT_MF = long term Magic Formula
- MF = standard (trailing 12 months) Magic Formula
- EW Index = Equal Weight index return
- All portfolios were equal-weight
- They rebalanced the portfolios annually
This was the compound annual returns over the 38 year period from 1972 to 2010.
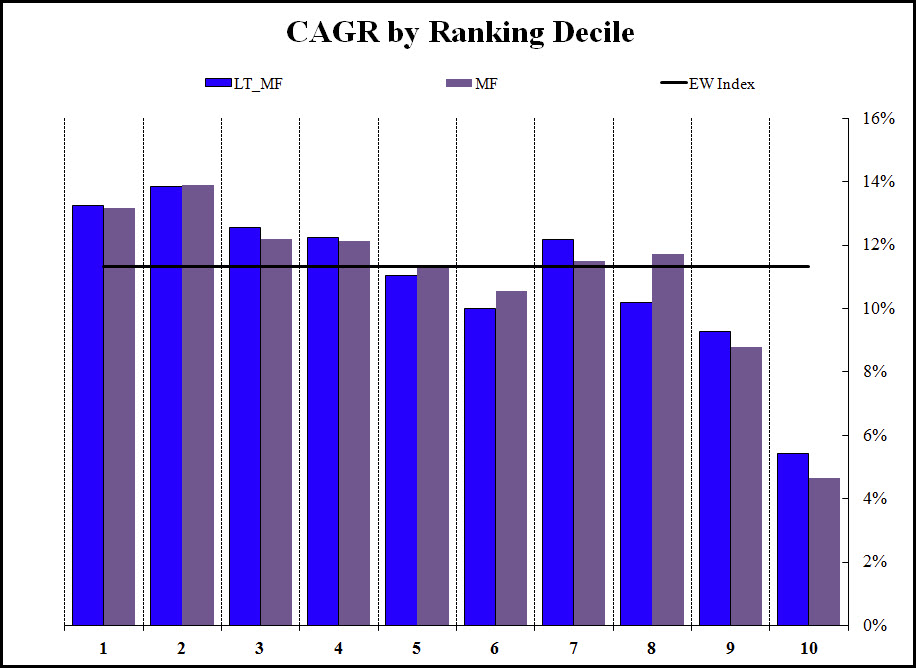
Source: Magic Formula: Long-Term 8-year vs. Short-Term
1 = Best ranked Magic Formula companies
10 = Worse rated Magic Formula companies
Blue bars = 8-year average Magic Formula performance
Grey bars = Trailing 12 months Magic Formula performance
What they found – long term does not add value!
As you can see the results were largely the same (blue bars same as grey). Using the long term Magic formula would not have added much to your returns.
This was unusual!
What was interesting is that the second 10% of Magic Formula companies (second decile, no 2 in the chart) performed better than the best ranked companies for both the long term and 12 month Magic Formula.
This confirms what the Finland research also found: the Magic Formula works, but the very highest-ranked companies are not always the best investments - the second tier often performs better.
See how the Magic Formula ranks stocks right now — free for 30 days
No credit card needed. Cancels automatically after 30 days.
#6 Does Systematic Magic Formula Investing Work?
In December 2010 two friends Philip Vanstraceele and Luc Allaeys finished an interesting research paper they called Systematic Value Investing: Does it really work?
Their testing included the Magic Formula investment strategy - Called MF in the tables below.
They wanted to find:
- The best investment strategy in Europe over the 11-years from June 1999 to June 2010
- If small portfolios perform better than large portfolios
- If 30 stock portfolios do better than 50 stock portfolios
These tests confirmed something important: systematic investing works, and the Magic Formula is one of the effective systems.
30 Stock Portfolios
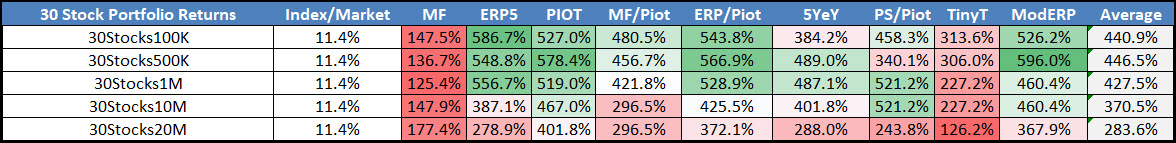
Click image to enlarge
50 Stock Portfolios
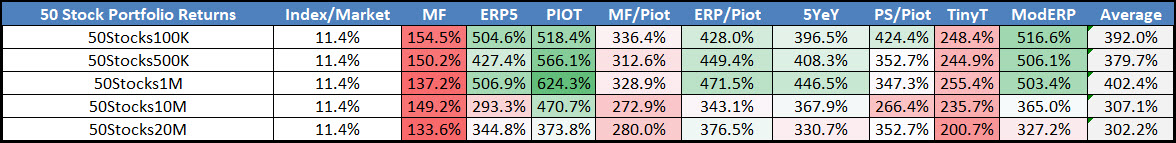
Click image to enlarge
The tables show you the return of all the strategies for both the 30 and 50 stock portfolios.
What is interesting?
- The pure Magic Formula (MF) did not do well
- The three ERP5 strategies (ERP5, ERP/Piot, ModERP) did very well
- On average the 30 stock portfolios performed better than the 50 stock portfolios
- Returns decreased as the portfolio size (amount invested) increased
- All the strategies performed a LOT better than the market
Let’s look at the portfolio size and number of investments changes returns.
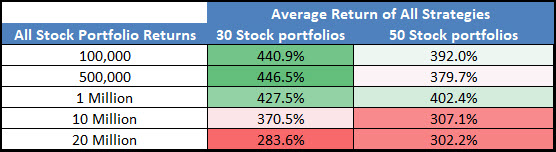
You can clearly see that the more money you have to invest the lower your returns – even though that is a nice problem to have.
Also 30 stock portfolios had higher returns than 50 stock portfolios except if you had €20 million to invest. But never forget diversification is one of the cornerstones of safe investing, and it helps you to sleep well at night – the highest return is not the most important thing.
Conclusion
So what are the main points you can learn from all this analysis?
- Systematic value investing works – all the strategies substantially beat the market
- Smaller – 30 stock portfolios – perform better than large – 50 stock – portfolios
- More money to invest lowers your returns
- Sticking to these strategies – or even just staying invested in the market – is a lot easier than it looks – just look at the maximum declines (Maximum Peak-to-Trough Decline) of all portfolios – Never underestimate your emotions in times of extreme losses.
Screen for Magic Formula stocks across 22,000+ companies — free trial
No credit card needed. Cancels automatically after 30 days.
Summary and Conclusion
So, what does all this tell you?
The Magic Formula isn’t just a strategy—it’s a time-tested system for finding great investments.
Whether you’re investing in the U.S., Europe, or smaller markets like Finland, it consistently points to companies with the best combination of quality and value.
Yes, there will be times when it underperforms. But as Joel Greenblatt explained, that’s part of its strength. When others give up, the Magic Formula shines—because it relies on principles that never go out of style.
By using the Magic Formula, you’re following a path that has created wealth for decades. Now, the only question is: are you ready to take the first step?
P.S. Screen for Magic Formula stocks yourself — free for 30 days
The Quant Investing screener ranks thousands of European, US and Asian stocks by earnings yield and return on capital — exactly as Greenblatt describes. You can run the screen, sort the results, and see which companies rank highest right now.
Your free 30-day trial includes full screener access, the historical back tester, a free copy of What Works on European Markets (74 pages), and our Best Ideas Newsletter. No credit card. Cancels automatically after 30 days.
Run the Magic Formula screen free for 30 days
No credit card needed. Cancels automatically after 30 days.
Frequently Asked Magic Formula Investing Questions
1. What makes the Magic Formula special?
The Magic Formula combines two simple but powerful ideas: buying quality companies and paying a low price for them. This system has worked across decades and markets because it’s based on universal investing truths.
2. Does the Magic Formula really work over the long term?
Yes. It’s been tested for decades in different markets and has consistently outperformed. The key is patience—no strategy wins every year, but the Magic Formula rewards those who stick with it.
3. Can the Magic Formula be used outside the U.S.?
Yes, it has been tested in Europe and other regions, showing positive results, though the performance may vary by market.
4. Should I combine the Magic Formula with other strategies?
Yes, significantly. Our own testing in Europe from 1999 to 2011 showed that combining the Magic Formula with 6-month price momentum increased returns from 182.8% to 783.3% over the 12-year period — a 600% improvement. The 2016–2025 back test also shows the momentum-combined version outperforming on a CAGR basis. Adding a momentum filter is the single biggest return improvement we found in testing.
5. What risks should I be aware of with the Magic Formula?
The strategy can lead to short-term losses and underperformance, requiring discipline to stick with it during tough times.
6. Is it better to invest in the highest-ranked companies?
Not always. Both the Finland study (1997–2010) and Alpha Architect's 38-year US test found that companies ranked just below the very top - roughly the 26th to 50th percentile — outperformed the highest-ranked
companies. The likely reason: the very top-ranked companies are sometimes cheap for a reason.
7. How often should I rebalance my Magic Formula portfolio?
Annual rebalancing is recommended, but you can adjust based on your specific investment strategy and market conditions.
8. Does the Magic Formula work for small portfolios?
Yes, it has been effective even with smaller portfolios, though returns might differ slightly compared to larger ones.
9. What is the average return I can expect with the Magic Formula?
In Europe from 1999 to 2011 the best-ranked Magic Formula companies returned 182.8% versus 30.5% for the market. Combined with momentum, returns reached 783.3% over the same period. In the 2016–2025 back test, the strategy returned +10.7% CAGR versus +9.5% for the benchmark. Past performance does not guarantee future results, and all strategies underperform for periods.
10. Can I use the Magic Formula with a limited number of stocks?
Yes, even with a smaller number of stocks, the Magic Formula has shown strong performance, though diversification is still recommended.
Please note: This website is not associated with Joel Greenblatt and MagicFormulaInvesting.com in any way. Neither Mr Greenblatt nor MagicFormulaInvesting.com has endorsed this website's investment advice, strategy, or products. Investments recommendations on this website are not chosen by Mr. Greenblatt, nor are they based on Mr Greenblatt's proprietary investment model, and are not chosen by MagicFormulaInvesting.com. Magic Formula® is a registered trademark of MagicFormulaInvesting.com, which has no connection to this website.
