

If you feel lost picking stocks, this article shows you a simple, proven system that works. You will learn how to use the Piotroski F-Score with Price-to-Book to find cheap, financially strong stocks, without predictions or complex calculations. A 23-year study shows this strategy beat the market by 5.8% per year. You will see exactly how it works, when it outperforms, and how to use it yourself in 30 minutes every quarter. Best of all, it helps you avoid weak companies and stay disciplined. This is a must-read if you want a strategy you can stick with.
Estimated Reading Time: 6 minutes
The Simple Strategy That Keeps Beating the Market
If you ever felt overwhelmed picking the right stocks, you are not alone. The good news? There is a simple system that has helped investors like you for years, and it still works. It is called the low Price to Book high Piotroski F-Score investment strategy.
This strategy is not about chasing trends or listening to noisy headlines. It is about using a clear checklist to find cheap stocks that are financially strong. A new study tested the strategy over 23 years of recent U.S. market history.
In this post, I will show you exactly how it works, how well it performed, and how you can use it in your own portfolio.
What Was Tested?
You know we have written numerous articles about the Piotroski F-Score but does the original low Price to Book high F-Score strategy still work in the real world?
Well, that is what two researchers wanted to know. If the low Price to Book and high F-Score strategy still works. They tested how it performed on U.S. stocks from 2000 to 2022, using strict rules any investor can follow.
They built a system that ranked stocks on two indicators:
-
Value – How cheap the stock is based on Book-to-Market.
-
Quality – How strong the company’s finances are, measured by 9 accounting checks.
They picked the 40 best-ranked stocks every quarter and tracked their performance. That is it. No guessing. No news watching. Just rules.
What Was Included and What Was Left Out?
This strategy was tested on U.S. stocks only, listed on the NYSE, NASDAQ, and AMEX. That gives it wide coverage and realistic results.
But not every company made the list:
-
Microcaps were excluded – These are tiny, hard-to-trade stocks with low liquidity.
-
Financial companies were left out – Their accounting works differently, so they do not fit the strategy.
By focusing on larger, more liquid stocks, the strategy stayed simple and practical.
How the Research Avoided Bias
This was not a sloppy backtest. The researchers made sure everything was realistic:
-
They used data from trusted sources (CRSP and Compustat).
-
They added a six-month delay on financial data—so only numbers that would have been known at the time were used.
-
They rebalanced every 3 months, just like you would in real life.
This means the results show what you could expect if you followed the system, not just perfect hindsight.
Exact Steps of the F-Score Strategy
Here is exactly how the Price to Book and Piotroski F-Score was used in the study:
-
Find Cheap Stocks - Rank all stocks by Book-to-Market (inverse of Price to Book). The higher, the cheaper.
-
Score Financial Strength - Use 9 simple checks. If a company passes one, it gets 1 point:
-
Profit this year?
-
Positive cash flow?
-
Profit improving?
-
Cash flow better than profit?
-
Less debt?
-
Better liquidity?
-
New shares issued?
-
Better margins?
-
More efficient with assets?
-
Combine the Two Ranks
Add the value and quality ranks together. The stronger and cheaper the company, the better the combined ranking. -
Buy the Top 40 Stocks
Every quarter, invest in the best 40 stocks based on total score. -
Rebalance Quarterly
Repeat every 3 months with updated data.
That is it. No opinions. No forecasts. Just a repeatable process.
How Often the Portfolio Was Rebalanced
The strategy was rebalanced once every quarter. That means you update the list and replace the 40 stocks with a fresh batch of winners. It is frequent enough to stay current, but not so often that you are drowning in trades.
For you, this means a simple schedule: check the screener once every three months, update your portfolio, and let the system do the work.
How the Strategy Performed
Over the full period (2000–2022), the Piotroski F-Score strategy:
-
Beat the market by 5.8% per year
-
Had a Sharpe Ratio of 0.59 (better than the S&P 500 at 0.43)
-
Delivered a CAPM Alpha of 5.8%
Even when adjusted for risk, the strategy showed real, consistent outperformance.
Annualised Returns, Sharpe Ratio, Max Drawdown
Here are the summarised results:

Piotroski F-Score = Low Price to Book and high Piotroski F-Score investment strategy
Sharpe Ratio measures risk-adjusted returns (higher is better).
Max Drawdown shows the worst peak-to-trough decline.
CAPM Alpha measures how much a strategy outperforms (or underperforms) the market after adjusting for risk. It tells you whether an investing strategy provides returns that cannot be explained by general market movements.
Source: Formula Investing
Yearly Returns from 2000 to 2022
The following table shows long only annual returns of the 40 top-ranked Low Price to Book and High Piotroski F-Score stocks. The portfolios were rebalanced quarterly with value-weighted position sizing capped at the 80th percentile of the NYSE stocks market value.
Market returns are the value-weighted returns of all stocks in the final stock universe. The back test period is 23 years from January 2000 to December 2022.
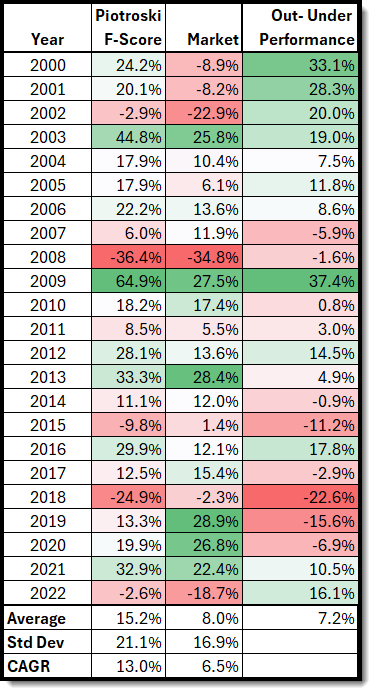
Piotroski F-Score = Low Price to Book and high Piotroski F-Score investment strategy
Source: Formula Investing
Note: I retyped the table and did not get the same values in the research paper. This may because of rounding errors.
When the F-Score Did Best—and When It Struggled
The strategy did especially well during tough markets like 2000 to 2002 and 2009. That is when strong balance sheets really matter.
However, it struggled from 2018 to 2020, a period when high-growth tech stocks outperformed cheap value stocks. Even then, it still delivered long-term outperformance. The lesson? You need to stay disciplined and stick with the strategy even during dry spells.
If you do not you will miss out on the great returns when it starts working again, look at the returns in 2009, 2021 and 2022.
Click here to start finding Low PB and High F-Score companies for your portfolio NOW!
Why This Strategy Works?
The strategy works because it combines two proven ideas:
-
Cheap stocks tend to outperform (value effect)
-
Strong companies do better than weak ones (quality effect)
Together, these two forces create a strategy that not only finds undervalued stocks, but avoids the ones most likely to fail.
Should You Use the Price to Book F-Score Strategy?
If you want a simple, repeatable strategy that works, the strategy is a great place to start. It takes no forecasts, no fancy calculations, and no guessing. Just follow the rules.
It is especially good if:
-
You like value investing but want to avoid value traps.
-
You want a data-backed system that does not depend on luck.
-
You are willing to rebalance quarterly and stick with it long-term.
And the best part? You do not need a finance degree or a trading desk to do this. You just need the right screener and 30 minutes every few months.
Final Thoughts
The low Price to Book high Piotroski F-Score strategy proves that simple still works. You do not need to beat Wall Street at its own game. You just need a system that tilts the odds in your favour, then follow it with discipline.
Want to try this strategy yourself? The Quant Investing stock screener includes the Price to Book and Piotroski F-Score and lets you filter for the top-ranked value stocks in seconds.
We use the screener to invest our own money, that is why we built it.
👉 Explore the screener and build your F-Score portfolio today.
FREQUENTLY ASKED QUESTIONS
1. How do I actually use this strategy with my own money?
Start by screening for stocks with a high Book-to-Market ratio (cheap) and a Piotroski F-Score of 8 or 9 (strong). Every 3 months, pick the top 40 that meet both. Invest equal amounts in each one. Rebalance quarterly by selling the old list and buying the new top 40. All you need is a good stock screener that supports these filters and 30 minutes each quarter to update.
2. Why not just buy the cheapest stocks without the F-Score?
Because cheap stocks can be cheap for a reason. Many are in trouble. The F-Score acts like a filter that keeps out the ones with weak finances. This strategy combines value (low price) with quality (strong fundamentals), so you buy undervalued companies that are likely to survive and grow.
3. What if the strategy underperforms for a few years?
That will happen. From 2018 to 2020, the strategy lagged because growth stocks led the market. But over the full 23-year test, it still beat the market by 5.8% per year. The key is sticking with it. If you jump ship when it struggles, you will miss the big gains when it rebounds—like in 2009 and 2021.
4. Can I do this if I only invest in European stocks or other markets?
Yes, but the study focused on U.S. stocks. You can apply the same system elsewhere, just make sure your screener covers that region and the financial data is solid. The logic still works: cheap + strong = higher odds of success. Just test it before investing.
5. Is it too late to start now?
No. The strategy was tested from 2000 to 2022 and still works. The best time to start is when you are ready to follow a system. What matters most is your discipline. Stick to the rules and give it time.
6. How much time does this take each month?
Very little. Once every 3 months, run your screener, sort by combined value and F-Score, pick the top 40, and update your portfolio. That is it. No earnings calls. No forecasts. Just follow the checklist. Many investors spend more time reading the news with worse results.
7. Why should I trust this over expert advice or market news?
Because it is based on facts, not opinions. The strategy uses audited financials and a rules-based approach tested over 23 years. It avoids emotions, hype, and bias. Experts and news are often wrong, and rarely consistent. A good system beats guesswork—especially in the long run.
Click here to start finding Low PB and High F-Score companies for your portfolio NOW!
