

If you want a proven way to beat the market without relying on hunches or headlines, this article is for you. It shows how four simple investing formulas backed by decades of data, still deliver strong returns today.
You will learn which strategy suits your goals, how each one performs, and what to expect during rough markets.
The best part? These systems are clear, repeatable, and built for real investors like you. No guesswork. No gurus. Just results you can trust. This article will help you invest smarter and stay disciplined for long-term success.
Estimated Reading Time: 6 minutes
If you have wondered if there is a simple way to beat the market? You are not alone.
Many investors look for proven strategies that take the guesswork out of picking stocks. That is exactly what formula investing (also called quantitative investing or quant investing) tries to do. Instead of relying on gut feelings or expert predictions, formula investing uses strict, rule-based methods to find winning stocks.
It is exactly what we do here at Quant Investing.
That is why we were glad to get an 2024 research paper Formula Investing by Marcel Schwartz and Matthias X. Hanauer both from the Technical University of Munich.
In the paper they tested four of the most popular formula-based strategies over nearly 60 years (July 1963 to December 2022), across different market conditions to see if they still work in today’s market.
The results were promising, with a few surprises.
What Strategies Were Tested?
The study focused on four well-known investing strategies. Each formula uses a different method to find ideas, but all aim to find companies that will outperform the market.
-
Piotroski F-Score – For this strategy, the researchers ranked the universe using the book-to-market ratio (inverse of price to book). The higher the ratio, the cheaper the stock. They then combined this ratio with the Piotroski F-Score, the higher the better into a single ranking by both value and financial health. This finds the strongest, cheapest companies.
-
Magic Formula – Created by Joel Greenblatt, this method ranks stocks based on two key measures: how profitable they using Return on Invested Capital are and how cheap they are based on EBIT to Enterprise Value. This is the strategy that led to me becoming a quant investor.
-
Acquirer’s Multiple – This formula, developed by Tobias Carlisle, focuses purely on finding the cheapest stocks based on a company’s enterprise value to operating profit which was defined as EBITDA – Capital Expenditure. This is a great deep value strategy.
-
Conservative Formula – This method selects stocks that have low volatility but high in momentum and shareholder payouts. It is designed to reduce risk while still achieving strong returns. This is a great strategy focused on low volatility stocks. To implement it every stock was ranked by three indicators. 1. Low Volatility over the past 36-months (the lower the better) 2. High Momentum over the past 12 months (excluding the last month) the higher the better. High Net Payout Yield (NPY) which was calculated as dividend yield + net share buyback percentage (Shareholder Yield) the higher the better. The three ranks were then added together. The lowest score was the best ranked company.
Each formula has been praised for its ability to pick good stocks. But do they still work today? The study set out to find the answer.
What Companies Were Included and Excluded?
The research focused on the U.S. stock market because it has the most reliable long-term data. The study included stocks from the NYSE, NASDAQ, and AMEX exchanges. However, not every stock made the cut. Microcap stocks were excluded—these are the smallest, least liquid stocks in the market. While they can sometimes offer big gains, they are also riskier and harder to trade. Financial companies were excluded because many of the formulas rely on accounting measures that cannot be calculated for banks and insurance firms.
By focusing on larger, more liquid stocks, the study ensured that the formulas could be realistically used by individual investors like you without worrying about trading costs or bid ask spreads.
How Did the Research Avoid Biases?
One of the biggest challenges in back testing is avoiding bias. If the test is not done right, the results can be misleading. This study took several steps to make sure the findings were dependable.
First, the researchers used historical data from CRSP and Compustat, which are widely trusted sources for historical stock market data.
Second, they applied a minimum six-month lag to financial data. This means they only used information that would have been available at the time, preventing any “look-ahead bias.”
Finally, they rebalanced portfolios every quarter based on updated stock rankings. This is more often than we suggest you rebalance your portfolio, but it is good for backtesting as it better captures the performance of the strategies.
By following these strict rules, the study ensured that the results reflected what you might experience in the real world.
Company Selection Criteria
The researchers ranked stocks based on the specific strategy. The study then selected the top 40 stocks from each formula to create a portfolio. This is good because instead of investing across hundreds of stocks, these portfolios focused on the best-ranked stocks according to each formula.
The stocks were market value-weighted but capped (capped at the 80th percentile), meaning that no single stock dominated the portfolio. This keeps the portfolios balanced and ensured that performance was not driven by just a few big winners.
The approach is good. By sticking to the top stocks in each formula and rebalancing regularly, the study mirrored what you could do in your own portfolio.
How Often Were Portfolios Rebalanced?
As mentioned, the study rebalanced quarterly, meaning stocks were reviewed and updated every three months. This ensured that the portfolios always held stocks that best fit the formulas.
This is the benefit of a strict, rules-based approach, meaning stocks were added or removed based solely on their formula rankings. There was no guessing, no human judgment, just a clear, systematic process.
If you are using formula investing, yearly rebalancing can be better to keep your portfolio in line with the strategy while minimising trading fees.
Do These Formulas Still Work?
The results showed that all four formulas beat the market over the long run. However, the performance varied depending on the strategy.
-
The Acquirer’s Multiple had the highest raw returns, meaning it selected stocks with the biggest gains.
-
The Conservative Formula had the best risk-adjusted returns, returns taking risk as measured by volatility into account. This makes it an excellent choice if you want more stable returns.
-
The Magic Formula showed the highest remaining alpha after adjusting for market factors. This means it had something unique (probably quality and value) driving its success.
-
The F-Score strategy was still works but had weaker returns in recent years compared to the others.
One important finding was that performance has declined since 2000, like all valuation-based strategies.
While the formulas still work, their market outperformance has weakened. This suggests that as more investors adopt these strategies, the market adjusts, making it harder to achieve the same level of outperformance. Or growth investing just had an incredible performance run.
Click here to start finding ideas that EXACTLY meet your investment strategy.
How The Strategies Performed
Here are the Annualised Returns, Sharpe Ratios, and Drawdowns for Each Formula.
The table shows the performance statistics for long-only portfolios of the 40 top-ranked stocks per investing formula. All the metrics were annualised, with the exception of maximum drawdown and CAPM beta. The portfolios were rebalanced quarterly, and the back test period was the 23 years from January 2000 to December 2022.
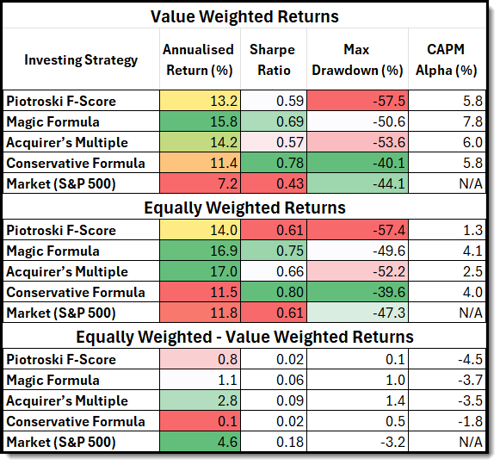
Sharpe Ratio measures risk-adjusted returns (higher is better).
Max Drawdown shows the worst peak-to-trough decline.
CAPM Alpha measures how much a strategy outperforms (or underperforms) the market after adjusting for risk. It tells you whether an investing strategy provides returns that cannot be explained by general market movements.
Source: Formula Investing
Annual Long Only Portfolio Returns
The following table shows long only annual returns of the 40 top-ranked stocks per investment strategy. The portfolios were rebalanced quarterly with value-weighted position sizing capped at the 80th percentile of the NYSE stocks market value.
Market returns are the value-weighted returns of all stocks in our final stock universe. The back test period is 23 years from January 2000 to December 2022.

Source: Formula Investing
Note: I retyped the table and did not get the same values in the research paper. This may because of rounding errors.
Market Out-or Underperformance
In this table I deducted the yearly market performance from the performance of the investment strategy. For example, in 2000 for the Piotroski F-Score the value was calculated as 24.2% - -8.9% = 33.1%.
I then colour coded the values to with highest dark green (biggest market outperformance) and lowest dark red biggest market underperformance).

Source: Formula Investing
Note: I retyped the table and did not get the same values in the research paper. This may because of rounding errors.
Click here to start finding ideas that EXACTLY meet your investment strategy.
Surprising Findings
As you can imagine no single formula was the best across all measures. Some had higher returns, while others had lower risk. This means that choosing the right formula depends on your personal investing style and risk tolerance. There is no way you can know this in advance. That is why you must choose the strategy that suits your nature, as this will let you stick to it when it underperforms. It will underperform, just look at all the red, especially dark red returns.
From 2000 to 2004 all the strategies performed great with only the Conservative Formula lagging in 2003 and 2004.
Between 2018 and 2020 all strategies underperformed the market severely during the so called “Quant Winter” just before a vaccine for the COVID virus was announced.
Over the complete 60 year back test period the Conservative Formula stayed the most resilient, it offered positive momentum exposure and consistently low volatility, this makes it could be a desirable choice during market downturns.
The Magic Formula worked especially well after the year 2000. It showed good returns with low risk and achieved the highest raw returns. Also, the highest average market outperformance from 2000 to 2022.
As you can imagine, the performance of the best rated companies in all formulas flattened out since the year 2014 when the tech growth bubble really started.
This means the formulas show impressive performance over the full back test period but had periods of underperformance. As we keep saying this is true for all great investment strategies.
The takeaway? These formulas still work, but they need patience. They go through periods of underperformance, and sticking with them through tough times is crucial.
Cumulative Relative Performance of The Best and Worse Ranked Companies
The following chart shows you the cumulative compounded performance of the 10% best ranked companies (D1) and worst 10% ranked companies (D10) compared to the overall market using a specific investment strategy.
As mentioned, the portfolios were rebalanced every three months and weighted by market value, with a cap at the 80th percentile of NYSE stocks. The market return is the cumulative compounded performance of all stocks in the investment universe (US market excluding microcaps and financial stocks), weighted by value. The data covers the nearly 60 years from July 1963 to December 2022.

Source: Formula Investing
Risk And Return by Strategy and Portfolio Size
This chart below shows you the annualised strategy performance of the long-only portfolios with a different number of companies.
It shows the standard deviation (tracking error) of returns on the x-axis and the Cumulative return (outperformance) on the y-axis.
The market return is the value-weighted return of all stocks in the investment universe. The sample period is the 23-year period from January 2000 to December 2022.

Source: Formula Investing
Lower Portfolio Size Not Always Higher Returns
As you can see the lower the number of stocks the more volatile the yearly returns, but interestingly a lower number of companies would not have given you materially higher returns.
Summary and Conclusion
So, should you use formula investing?
The short answer is yes, BUT with the right expectation.
These formulas have been proven to work, but they are not magic. They require patience, discipline, and a willingness to stick with them through good times and bad. It is the same with any investment strategy. Irrespective of how well it performs over the long term there will ALWAYS be periods it underperforms.
Based on this research if you want higher returns but can handle some volatility, the Acquirer’s Multiple or Magic Formula might be best. If you prefer a more stable strategy with lower risk, the Conservative Formula could be a better fit. And if you want to focus on value investing in companies with fundamentally strong or quality companies, the F-Score is worth considering.
Formula investing is not about quick wins. It is about following a proven system and staying the course over the long run. If you can do that, you will have a strategy that puts the odds in your favour, something every investor needs.
Want to explore formula investing for yourself? Check out our stock screener that applies these formulas to global markets.
Click here to start finding ideas that EXACTLY meet your investment strategy.
FREQUENTLY ASKED QUESTIONS
1. Do I need to be a math expert to use formula investing?
No. You do not need advanced math. These strategies use simple formulas based on ratios you can find in most financial reports. Once you understand how each formula ranks stocks, all you do is follow the rules. Tools like Quant Investing's screener make this easy by doing the calculations for you.
2. Which formula is best if I want steady returns with less stress?
The Conservative Formula is a great fit. It focuses on low-risk stocks. It picked companies with low price swings, strong price trends, and good shareholder returns. This gave it the highest Sharpe Ratio, meaning the best return for the risk taken .
3. How long should I hold stocks I pick from a formula?
Once a year is often enough. The study used quarterly updates, but that adds more trading and fees. If you rebalance every 12 months, you stay close to the formula and avoid overtrading. Pick a date and stick with it, this helps build long-term discipline .
4. Can I mix formulas or should I stick to one?
You can mix them, but start with one that fits your personality. If you like cheap stocks, try the Acquirer’s Multiple. If you care about quality and growth, the Magic Formula might suit you better. Mixing too early can make it hard to stay consistent. Pick one. Stick with it. Learn as you go.
5. Why do these formulas still work if everyone knows about them?
Because most investors lack discipline. They get scared when a strategy underperforms. They chase what is hot. But formula investing works because it avoids emotional decisions. The real edge is not the formula, it is your ability to follow it, even when it feels hard .
6. What if one of my stocks is losing money—should I sell it early?
Stick to the rules. Only sell during your scheduled rebalance unless the stock breaks a key risk rule you can set up for yourself (like a stop-loss). Many formula-picked stocks go through rough patches before turning around. Selling too soon cuts off your future winners.
7. How do I pick the right formula for me?
Ask yourself:
-
Do I care more about returns or about avoiding big drops?
-
Am I okay seeing red for a while if I know the system works long term?
-
Do I want deep value, quality, or a balance?
Use the answers to match your style:
-
High returns, more bumps: Acquirer’s Multiple or Magic Formula.
-
Steady ride, fewer surprises: Conservative Formula.
-
Value + quality: Piotroski F-Score.
Your goal is not to find the perfect formula. It is to find one you can follow with confidence.
Click here to start finding ideas that EXACTLY meet your investment strategy.
