

At first, I did not understand why so many subscribers were asking me to add 36-month volatility to the stock screener.
Only after a subscriber sent me the research study, did I find out about the Conservative Formula: Quantitative Investing Made Easy investment strategy, published on 21 Mar 2018 by Pim van Vliet and David Blitz both from Robeco Quantitative Investments.
Here is the abstract from the research paper:
We propose a conservative investment formula which selects 100 stocks based on three criteria:
-
- low return volatility,
- high net payout yield, and
- strong price momentum.
We show that this simple formula gives investors full and efficient exposure to the most important factor premiums, and thus effectively summarizes half a century of empirical asset pricing research into one easy to implement investment strategy.
With a compounded annual return of 15.1 percent since 1929, the conservative formula outperforms the market by a wide margin. It reduces downside risk and shows a positive return over every decade.
The formula is also strong in European, Japanese, and Emerging stock markets, and beats a wide range of other strategies based on size, value, quality, and momentum combinations.
The strategy had great returns, so it immediately got my attention and we added 36-month momentum to the Quant Investing stock screener.
Just how well did the strategy perform you may be thinking.
Conservative strategy returns
Just to give you an idea of how good the returns were here is a short extract from the paper.
Returns in the USA:
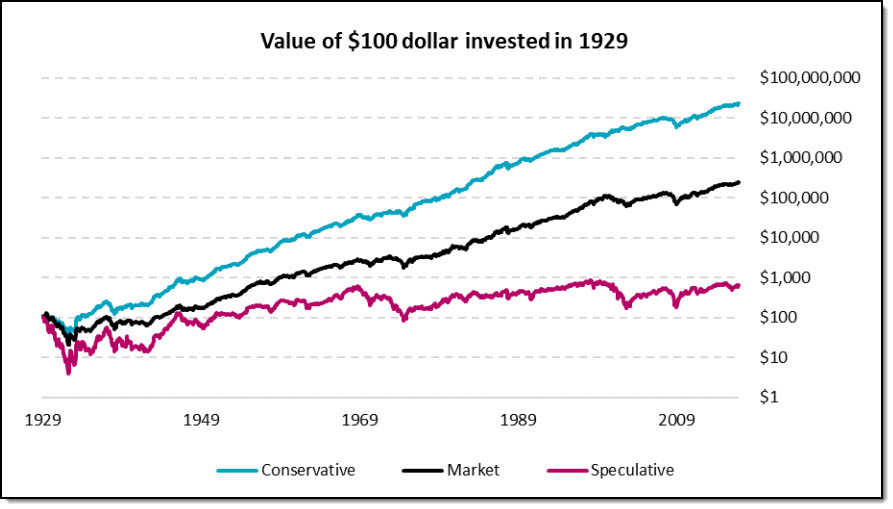
Click to enlarge
Source: Conservative Formula: Quantitative Investing Made Easy by Pim van Vliet and David Blitz
Results are without implementation costs and before taxes.
As you can see the investment strategy worked over long periods of time.
This is how the strategy performed over various decades:
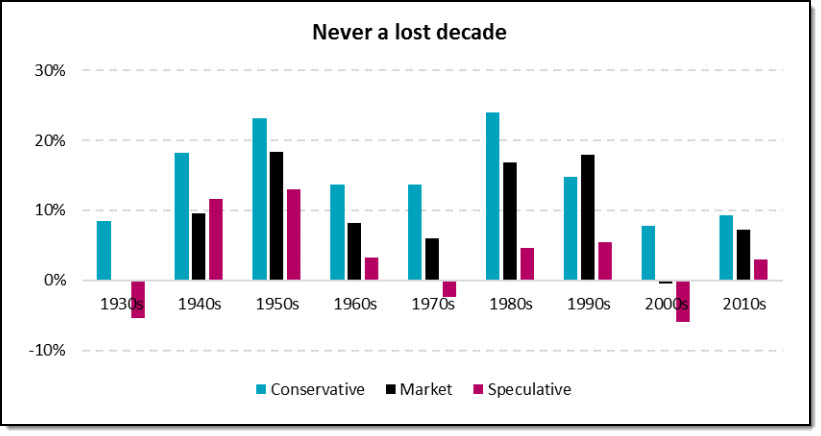
Click to enlarge
Source: Conservative Formula: Quantitative Investing Made Easy by Pim van Vliet and David Blitz
Results are without implementation costs and before taxes.
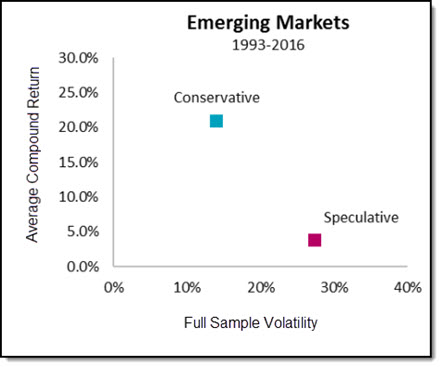
Conservative strategy performance in the rest of the world
This is how the conservative strategy performed throughout the world. I added the green arrows.
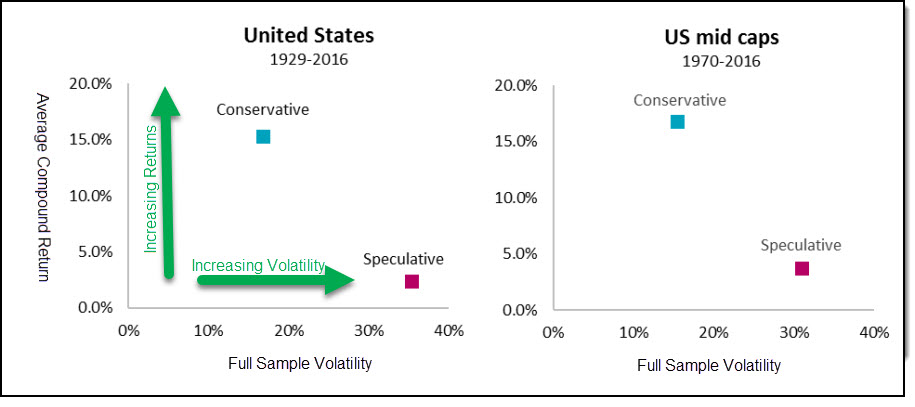
Click to enlarge
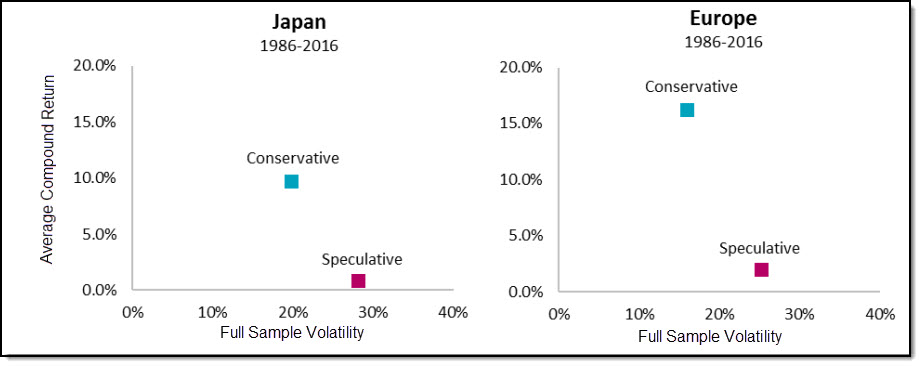
Click to enlarge
Click to enlarge
Low volatility consistently outperformed
As you can see low volatility companies (the blue dot in the above charts) consistently outperformed speculative or high volatility companies (the red dot) in the above charts.
Click here to start getting Conservative Formula investment ideas NOW!
It is a great strategy anywhere in the world
The above charts also show that it is a great investment strategy for you to follow irrespective of where in the world you invest. Also, because you can use the strategy worldwide, it means your universe of investment ideas is big.
Large caps are easy to buy
Important, because the strategy only looks at large companies that you can easily buy at most brokers, even in your tax-free accounts.
How to implement a strategy in your portfolio
Now for the most important part.
How to easily implement the Conservative Strategy in your portfolio.
You can break the strategy down in the following easy to follow steps (more detailed information below):
- Create a template with the following output columns: Name, Country, ISIN, Ticker, Close Price, Volatility 36m, Price Index 12-1m, Shareholder Yield, Market Value (USD), Dividend Yield,– the last column is just for info
- At the end of each quarter select the 1,000 largest stocks in your investment universe
- Rank the 1,000 companies by historical 36-month volatility from low to high
- Choose the 500 stocks with the lowest 36-month volatility
- Rank these companies first by 12-1-month price momentum from high to low. The company with the best momentum gets a 1 and the one with the worse gets 500.
- Then rank then again by Shareholder Yield from high to low. The company with the highest Shareholder Yield gets a 1 and the one with the worse gets 500.
- Calculate and add an average rank of the Momentum and the Shareholder Yield ranking of every one of the 500 companies. For example, if Company X has a Momentum rank of 20 and a Shareholder Yield of 40 its average rank will be 30.
- Sort the 500 companies by the average rank (Momentum and Shareholder Yield) from low to high. Remember the lower the better ranked the company is.
- Buy the same amount (equal weight) of the top 100 companies
Create an output template
Create a template with the following output columns:
Name, Country, ISIN, Ticker, Close Price, Volatility 36m, Price Index 12-1m, Shareholder Yield, Market Value (USD), Dividend Yield,– the last column is just for info.
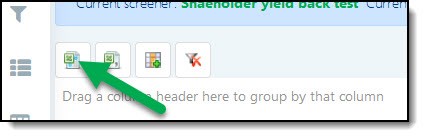
This will let your screen results look like this:

Click to enlarge
Set up your screen as follows
1. Select MV Size as Primary screening factor
2. Set the Slider range from 0% to 10% to show the largest companies
3. Choose the countries you want to include in your screen
4. Select Last 6 months to only get companies with recently updated results
5. Select the output Template you created in the step above
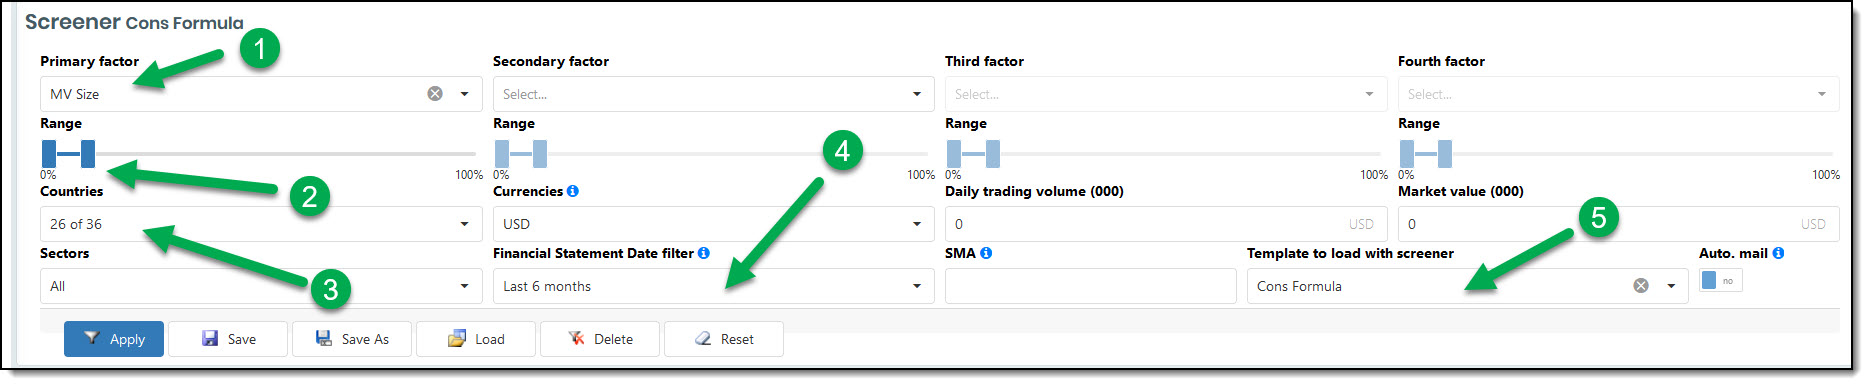
Click to enlarge
Click here to start getting Conservative Formula investment ideas NOW!
Export the results to Excel
Click the Export to MS Excel icon to export the results of your stock screen.
Add the following columns to your spreadsheet:
1. Momentum, SH Yield and SH Yield + Momentum
2. Turn on the Filter function in Excel to make the sorting easier
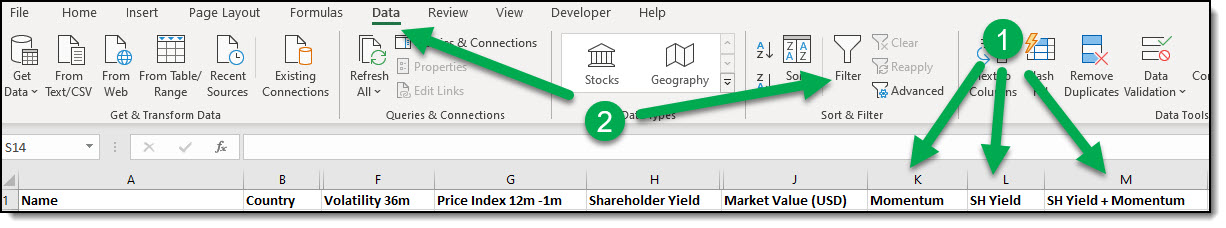
Click to enlarge
Then do the following:
- Sort the exported screener results by Market Value (USD) from large to small
- Keep the largest 1000 companies and delete the rest
- Sort the remaining list of 1000 companies by Volatility 36m from low to high
- Keep the 500 companies with the lowest volatility and delete the rest with high volatility
- Sort the 500 companies by Price Index 12-1m from high to low
- Add the company’s ranking in a column called Momentum. Company with highest Price Index 12-1m gets a value of 1, the next 2 until 500
- Sort the 500 companies, including the Momentum column by Shareholder Yield from high to low
- Add the company’s ranking in a column called SH Yield. Company with highest Shareholder Yield gets a value of 1, the next 2 until 500.
- In the new column called SH Yield + Momentum, calculate the average of the values you added in the Momentum and the SH Yield columns
- Sort the column SH Yield + Momentum from low to high.
- Buy the same amount (equal weight) of the top 100 companies
This is an example of the result my screen came up with:
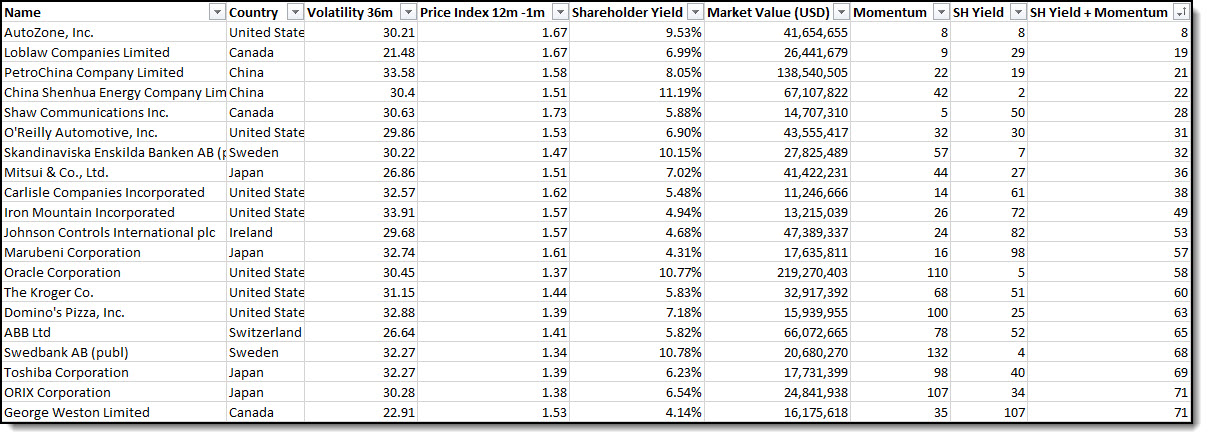
Click to enlarge
Click here to start getting Conservative Formula investment ideas NOW!
It is that easy to implement
As you can see it is a bit of work but quite easy to implement the Conservative Formula investment strategy in your portfolio.
Download the spreadsheet
Click on the link below to download the spreadsheet shown in the above screenshots.
Conservative Formula Excel Spreadsheet
PS To start getting Conservative Formula investment ideas now – Click here to sign up.
PPS It costs just more than €1 per day and if you do not like it you get your money back – it is as simple as that.
PPPS It is so easy to put things off and forget, why not sign up right now?
Click here to start getting Conservative Formula investment ideas NOW!
