

2021 so far has been a remarkably good investment year.
Nearly all investment strategies worked as markets recovered from the Covid crisis. The lowest return was 9.4%.
That said, the same as has been the case over the past three years, a lot of the investment strategies that worked very well in the past (over decades in up and down markets) did not do well in the first half of 2021.
This was especially true in North America.
Results were ALL over the place
Performance was all over the place – meaning it was impossible to say what strategy would have done well based on long-term back tested returns of strategies that work.
What investment strategies worked in 2021?
So, what worked best world-wide in the first half of 2021?
Here is a short summary:
- Buying companies with bad 12-month momentum +28.8%
- Buying companies with low price to book (value) +26.2%
- High Shareholder Yield (value) companies also performed well up +25.8%
- Good Adjusted Slope 90 days (good 3-month momentum) companies did just as well at +25.4%
Before I show you the exact strategies and their returns first some information on what and how we calculated the returns.
What strategies we tested – on 10,700 companies worldwide
We looked at the performance of the following 19 investment strategies from 1 January 2021 to 30 June 2021:
- Large vs small companies (Quintile 1 = Biggest companies)
- Book to Market value (inverse of price to book)
- Earnings yield (EBIT/EV)
- Qi Value – the strategy I use in my own portfolio
- Price Index 6m (Current price / Price 6 months ago) also known as 6 months Momentum
- Price Index 12m (Current price / Price 12 months ago) also known as 12 months momentum
- VC One also known as Value Composite One rank
- VC Two known as Value Composite Two rank (Value Composite One with an additional ratio: Shareholder Yield)
- ERP5 ranking (Ranking based on Price to Book, Earnings Yield, Return on invested capital (ROIC), 5-year average ROIC)
- Shareholders Yield (Dividend yield + Percentage of Shares Repurchased)
- Dividend Yield
- Dividend growth 5 years (The geometric average dividend per share growth rate over the past 5 years)
- MF Rank (Magic Formula Ranking developed by Joel Greenblatt)
- Piotroski F-Score
- Qi Liquidity ranking (Adjusted Profits / Yearly trading value)
- Gross Margin Novy-Marx (gross profits / total assets) – the best quality ratio we have tested
- Free Cash Flow (FCF) Score (Calculated by combining Free cash flow growth with free cash flow stability)
- Adjusted slope average (125-day, 250 day) – momentum
- Adjusted slope (90 days) – momentum
Only companies worth more than €50 million trading more than €25,000 per day
We excluded companies with a market value less than €50 million and a median 30-day trading value less than €25,000.
This left a universe of around 10,700 companies which means each quintile of the All Developed Markets back test consisted of about 2,140 companies .
This large number of companies is good because it makes it unlikely that any one company impact the return of any quintile.
Markets worldwide then regions
The following stock markets (and regions) were included:
North American Markets
- USA
- Canada
European Markets
- All the Eurozone countries
- United Kingdom
- Switzerland
- Norway
- Denmark
- Sweden
Japanese Market
- Only Japan
Other Asian and Oceanic Markets
- Australia
- New Zealand
- Hong Kong
- Singapore
All companies in five groups – Quintile 1 the best
To test each of the strategies, using point in time data (so no look ahead bias), on 1 January 2020 we divided all the companies in the universe into five 20% groups or quintiles.
Quintile 1 shows the companies that scored best in for all the strategies we tested - Quintile 5 the worst.
For example, Quintile 1 shows the return of the 20% of companies with the highest book to market ratio (lowest price to book – cheap companies) at the start of the year.
And Quintile 5 shows the return of companies with the lowest book to market ratio (highest price to book ratio – expensive companies).
For Price Index 6m quintile 1 show companies with the best momentum (biggest share price increase over 6 months) and quintile 5 companies with the biggest price fall in the previous 6 months.
For the Piotroski F Score quintile 1 shows the return of companies with the best Piotroski F-Score (9 or 8) and quintile 5 those with the worse F-Score.
For the Size strategy quintile 1 shows the return of the 20% of companies with the biggest market value and quintile 5 the 20% smallest companies.
The best investment strategy world-wide in the first half of 2021
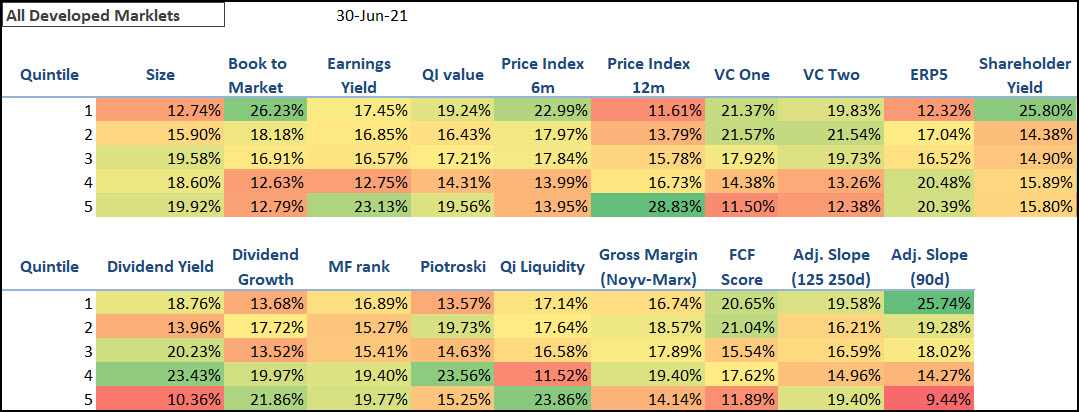
The following table summarises how all 19 investment strategies performed world-wide:
For reference the MSCI World Index gained +16.7% in Euro
Click image to enlarge
Best performing strategies worldwide
Source: www.quant-investing.com
How all the best rated companies (Quintile 1) perform?
- Average return Quintile 1 of all strategies: +18.5%
- Maximum return of Quintile 1 strategies: +26.2%
- Minimum return of Quintile 1 strategies: +11.6%
What worked?
Here are the two best performing Quintile 1 strategies:
- Investing in companies with a high Book to Market or low price to book (value) +26.2%
- High Shareholder Yield (value) companies also performed well up +25.8%
What did not work?
These were the worse Quintile 1 strategies:
- Companies with the best 12-month stock price momentum was the worst performing strategy and would have returned +11.6%.
- The second worse strategy was investingin good ERP5 value companies (quality, value) +12.3%.
Click Here – To get all the tools you need to implement all 19 strategiesNOW!
The best investment strategy in Europe in the first half of 2021
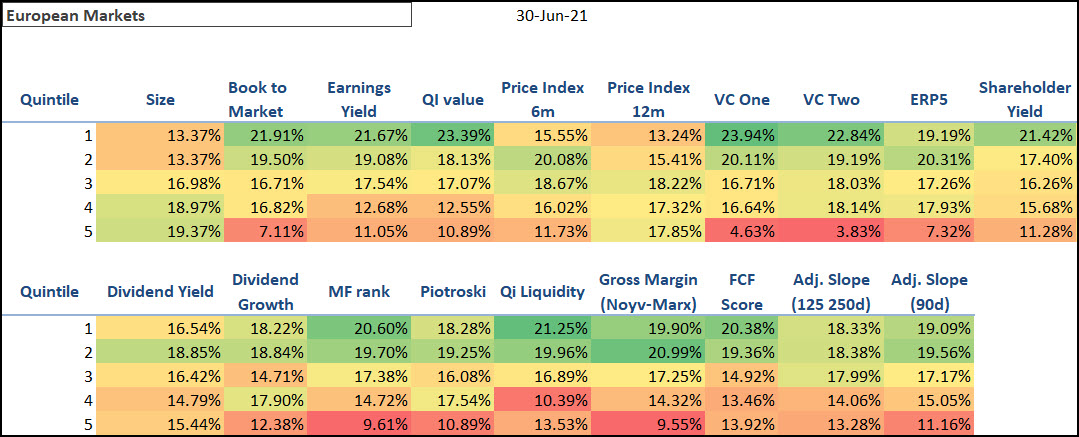
Below is the performance of all 19 strategies in Europe:
For reference the European STOXX 600 Index gained +13.5%
Click image to enlarge
Best performing strategies in Europe
Source: www.quant-investing.com
How all the best rated companies (Quintile 1) perform?
- Average return Quintile 1 of all strategies: +19.4%
- Maximum return of Quintile 1 strategies: +23.9%
- Minimum return of Quintile 1 strategies: +13.2%
What worked?
These were the best two Quintile 1 strategies:
- Buying the 20% of companies with the best Value Composite One value was the best investment strategy in Europe, it gained +23.9%.
- Using the Qi Value composite value indicator would have earned you the second highest return in Europe of +23.4%.
What did not work?
The two worse performing Quintile 1 strategies were:
- If you invested in high 12-month momentum companies, it would have been the worst strategy you could use as it returned only +13.2%.
- The second worse strategy wasinvesting in the biggest European companies which returned +13.4%.
Click Here – To get this weekly report and the tools to implement all 19strategies NOW!
The best investment strategy in North America in the first half of 2021
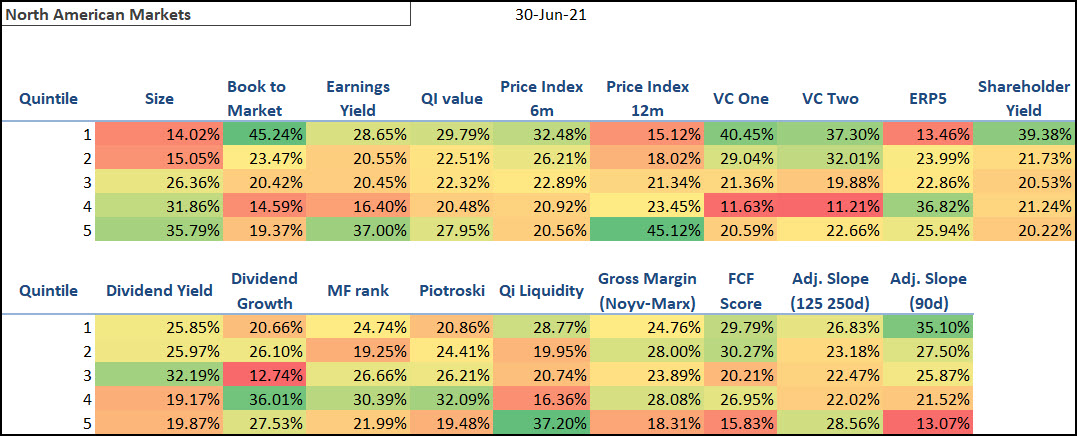
Below is the performance of all 19 strategies in North America:
For reference the S&P 500 Index gained +14.4%
Click image to enlarge
Best performing strategies in North America
Source: www.quant-investing.com
How all the best rated companies (Quintile 1) perform?
- Average return Quintile 1 of all strategies: +28.1%
- Maximum return of Quintile 1 strategies: +45.2%
- Minimum return of Quintile 1 strategies: +13.5%
What worked?
The two best performing Quintile 1 strategies were:
- Investing in companies with the lowest Price to book ratio (high Book to Market) was the best strategy returning +45.2%.
- Buying cheap Value Composite One companies would have earned you the second highest return of +40.5%
What did not work?
The two worse performing Quintile 1 strategies were:
- If you invested in quality value good ERP5 companies had the lowest return of +13.5%.
- Buying large companies would have given you the second lowest return of +14.0%.
Click Here – To get all the tools you need to implement all 19 strategies in your portfolio
This was your best investment strategy in Japan in the first half of 2021
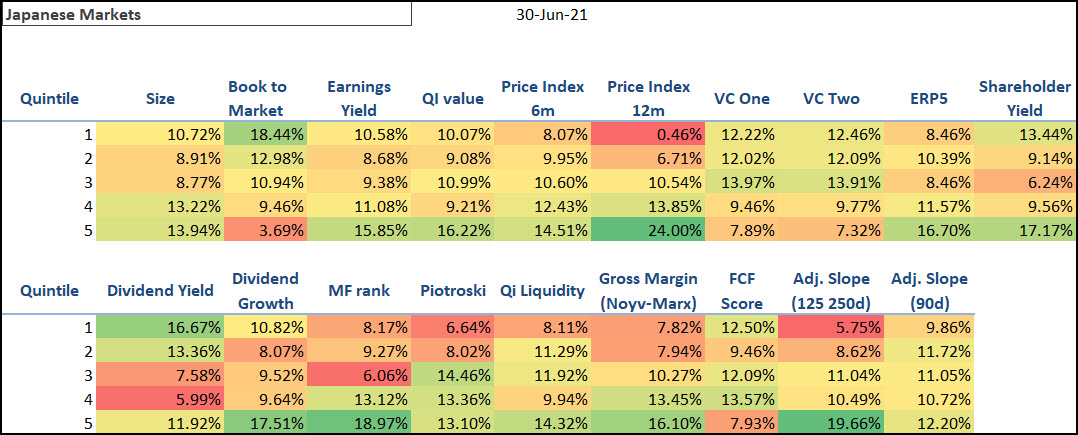
Below is the performance of all 19 strategies in Japan.
For reference the Japanese Nikkei 225 Index gained +8.2%
Click image to enlarge
Best performing strategies in Japan
Source: www.quant-investing.com
How all the best rated companies (Quintile 1) perform?
- Average return Quintile 1 of all strategies: +10.1%
- Maximum return of Quintile 1 strategies: +18.4%
- Minimum return of Quintile 1 strategies: +0.5%
What worked?
The two best performing Quintile 1 strategies in Japan were:
- Investing in value companies with the highest book to market or lowest price to book ratio was the best strategy returning +18.4%.
- The second-best strategy was buying companies with the highest dividend yield which returned +16.7%.
What did not work?
The two worse performing Quintile 1 strategies were:
- Buying companies with the largest 12-month momentum returned only 0.5%.
- If you invested in companies with the best Adjusted Slope 125- and 250-day momentum you would have had the second lowest return of +5.8%.
Click Here – To get this weekly report and the tools to implement all 19strategies NOW!
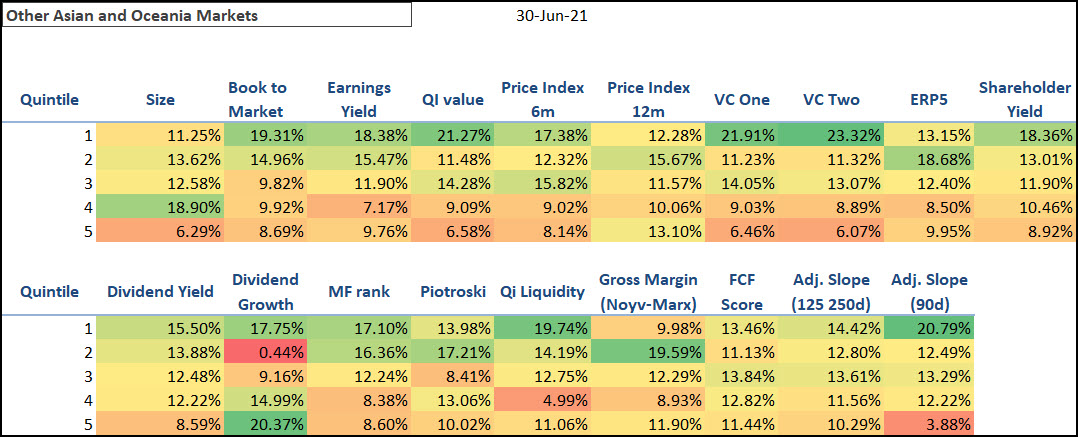
The best investment strategy in Asia and Oceania Markets in the first half of 2021
Australia, New Zealand, Hong Kong, and Singapore companies are included in this analysis.
For reference the iShares Core MSCI Pacific ex-Japan ETF (Australia, New Zealand, Hong Kong, and Singapore companies) returned +9.47%.
Click image to enlarge
Best performing strategies in Asia and Oceania
Source: www.quant-investing.com
How all the best rated companies (Quintile 1) perform?
- Average return Quintile 1 of all strategies: +16.8%
- Maximum return of Quintile 1 strategies: +23.3%
- Minimum return of Quintile 1 strategies: +10.0%
What worked?
The two best performing Quintile 1 strategies were:
- Investing in the best ranked Value Composite Two (value) companies was the best strategy returning +23.3%.
- Investing in companies with the best Value Composite One ranking was the second-best strategy returning +21.9%.
What did not work?
The two worse performing Quintile 1 strategies were:
- If you invested in high quality Gross Margin (Novy-Marx) companies, you would have had the lowest return of +10.0%.
- The next worse strategy was buying large companies. It would have given you a return of +11.3%.
Returns all over the place – This is normal
As you can see no one strategy worked everywhere – sometimes exactly the opposite worked – this just proves that over the short-term anything is possible.
A warning – investment strategy may stop working
Remember just because a strategy did well in 2020 does not mean it will continue to do so. As you can see the same strategy performed well in one region and terribly in another.
Jumping on the best performing strategy is most likely a bad idea - possibly a very bad idea.
In fact, your best strategy may be the worst performing strategy as it may turn around. Just like you I have no clue as to what strategy will work in the future and if someone says he does, he is lying.
You can read more about the best strategies, we have tested click here: Best investment strategies Quant Investing
Wishing you profitable investing for the rest of 2021
PS To get this report on a weekly basis as well as the tools to implement all 19 strategies (for less than an inexpensive lunch for two) in your portfolio sign up here.
PPS It is so easy to put things off, why not sign up right now?
Click Here – To get this weekly report and the tools to implement all 19strategies NOW!
