
Last updated: July 2026
In this blog post, you'll discover how to use the Golden Cross and Death Cross indicators to improve your stock market returns. You'll learn when to buy or sell stocks by understanding these simple moving average signals, making your investment decisions more precise. The post also covers how these indicators work best for larger companies and how to apply them using a stock screener. By the end, you'll feel more confident in timing your trades for better outcomes.
Knowing exactly when to buy or sell is not easy BUT here is a indicator you can use to help – it is called the golden cross and the death cross - and it can help if you are a trader or a long term investor.
- A golden cross is the 50-day moving average rising above the 200-day (buy signal); a death cross is the 50-day falling below the 200-day (sell signal).
- In the screener it is one ratio — Cross SMA 50/200 = 50-day ÷ 200-day: above 1 is a golden cross, below 1 a death cross.
- Screener slider settings: 0–30% finds golden-cross companies, 70–100% finds death-cross companies, and 30–70% finds stocks where a cross has just happened.
- In a back-test on Apple and Tesla, the golden cross reduced the worst drawdown (Tesla −65% vs −74% for buy-and-hold) but underperformed simply holding both stocks — it is a timing tool, not a stand-alone system.
- Golden-cross indicators are available across 42 world stock markets (over 22,000 companies) and 43 ETFs, updated weekly.
A golden cross is a buy signal that occurs when a stock’s short-term moving average (typically the 50-day) rises above its long-term moving average (typically the 200-day). The opposite is a death cross — the 50-day falling below the 200-day — which is a sell signal.
Cross SMA 50/200 = 50-day moving average ÷ 200-day moving average
A value above 1 is a golden cross; a value below 1 is a death cross.
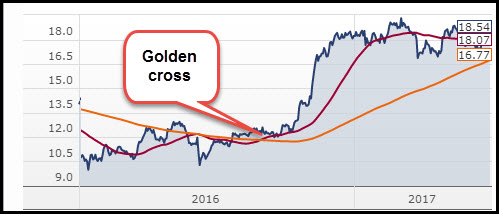
Golden cross (Buy signal) occurs when the short term moving average (red line) moves up through the long term moving average (orange line)
Opposite is the Death Cross
The opposite can of course also happen, when a short term moving average moves down and crosses over a longer term moving average.
This pattern is called a death cross, and is a sell signal as it shows the stock price is falling and may continue to do so.
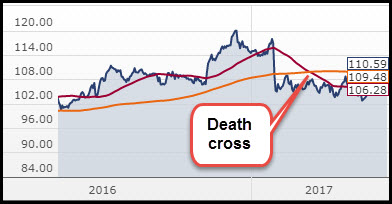
Death cross (Sell signal) occurs when the short term moving average (red line) moves down through the long term moving average (orange line)
Golden cross vs Death cross
The two are mirror images. A golden cross forms when the 50-day moving average rises above the 200-day — a buy signal, showing an upward trend. A death cross forms when the 50-day falls below the 200-day — a sell signal, showing a downward trend. In one number, the screener’s Cross SMA 50/200 is above 1 for a golden cross and below 1 for a death cross. Both are trend signals, so they work best on larger, steadier companies and are best used to time an already-researched decision, not to pick stocks on their own.
To understand exactly how the golden cross or death cross can help you, it is important that you know what a moving average is.
What is a moving average?
A moving average is an indicator that reduces the noise of daily stock price movements.
It is simply the average closing price of a stock measured over a number of trading days, typically 50 days, 100 days and 200 days.
For example, to calculate the 50 day moving average you simply average the closing price of the stock over the past 50 trading days into a single value or data point.
Moving average lags the stock price
Moving averages thus lag behind the current share price since it is based on past data. The longer the time period used to calculate a moving average, the greater the lag.
Thus, a longer term moving average (such as for 200 trading days) is used to measure long term price movements, while short term moving averages (such as for 50 days or shorter) is used as a short term indicator.
It shows you the trend
So when the short term average moves up and passes over the longer term moving average (golden cross), it shows you that there is an upward moving trend in the share price.
This is because the shorter moving average is more sensitive than a longer moving average. It reacts faster to more recent price changes.
How to use the golden cross
1. The golden cross is a good buy indicator
The golden cross is a great indicator to help you decide when to buy. Once you have done your research and decided to buy a company you can use a golden cross to help time your purchase.
The golden cross draws the attention of other investors and thus give you and higher trading volume, and possibly a fast profit, as other investors are also buying.
2. Better for large companies
Research has shown that the golden cross is best used for larger and more stable companies and does not work as well for smaller (more volatile) companies.
3. Longer period moving averages are better
For individual stocks longer period moving averages, for example 50 day and 200 day, provide a better signal than a moving average for a shorter period.
What a back-test shows
To put numbers on it, we ran the golden cross on two well-known stocks using daily split-adjusted prices from the Quant Investing database — the same Cross SMA 50/200 the screener uses.
The rule: hold the stock while the 50-day moving average is above the 200-day, and sit in cash while it is below, versus simply buying and holding the same stock over the same period. $10,000 invested, price-only, no costs or taxes, cash earns 0% when out of the market.
| Stock (period) | Golden cross | Buy & hold | Golden-cross worst drawdown | Buy-&-hold worst drawdown |
|---|---|---|---|---|
| Apple, Oct 2015–Jul 2026 | $51,900 | $113,500 | −42% | −39% |
| Tesla, Apr 2011–Jul 2026 | $247,500 | $2,402,000 | −65% | −74% |
Source: Quant Investing database, daily split-adjusted closes. Price-only; excludes dividends, costs and taxes. Past performance is not a guarantee of future results.
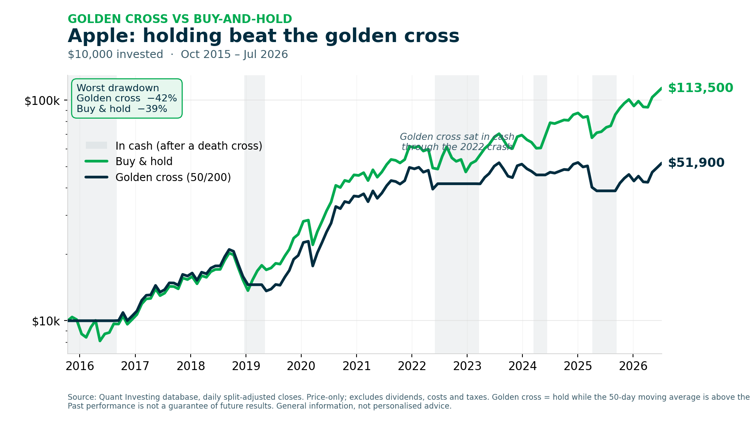
$10,000 in the golden cross versus buy-and-hold, Oct 2015 to Jul 2026. Buy-and-hold ends at $113,500; the golden cross at $51,900.
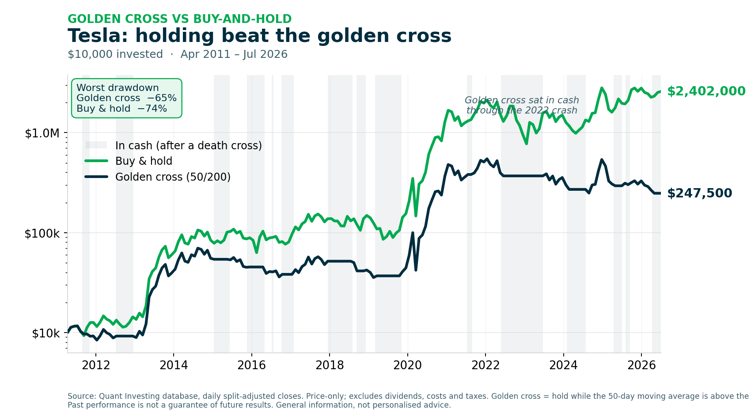
$10,000 in the golden cross versus buy-and-hold, Apr 2011 to Jul 2026. Buy-and-hold ends at $2,402,000; the golden cross at $247,500.
The honest result: on both of these strong long-term winners the golden cross underperformed simply holding, because each death cross sold the stock and the next golden cross usually bought it back at a higher price - cutting the winner short. In the charts, the navy line goes flat inside each shaded band (the periods it was in cash) while buy-and-hold keeps climbing.
It's one clear benefit came in the worst crash: on Tesla the rule kept you in cash from May 2022 while the stock fell from about $236 to a low of $108 (a further -54%), and it cut the maximum drawdown from -74% to -65%.
The takeaway matches the rest of this article: the golden cross is a timing and trend tool — most useful on larger, steadier companies and whole indices, and best used to time an already-researched buy or sell decision, not as a stand-alone system for high-growth single stocks, where letting your winners run has done better. This is a historical back-test on two stocks, not advice or a prediction.
See which stocks had a golden cross a year ago
Your free demo loads Cross SMA 50/200 — the exact golden-cross ratio in this article — as a pre-built factor across 22,000+ stocks in 42 world markets. Set the slider to 0%–30% to list the companies trading in a golden cross, or 30%–70% to find the ones where the 50-day had just crossed the 200-day. Because the demo runs on data from a year ago, these are the crosses the screener would have flagged twelve months ago.
Find last year's golden crosses
No credit card needed. Cancels automatically after 30 days.
Indicators available in the stock screener
There are a couple of indicators available in the screener which allow you to use the golden and death cross to buy and sell at the right time.
For individual companies, the typical golden and death cross of 50 day and 200 day moving averages is available.
How is it calculated?
In the Quant Investing stock screener the golden cross it is called Cross SMA 50/200 (SMA = Simple Moving Average) and is calculated as follows:
Cross SMA 50/200 = 50 day moving average / 200day moving average
What do the values mean?
If the Cross SMA 50/200 value is greater than 1, it shows you that the 50 day moving average is above the 200 day moving average (golden cross), a buy signal because of an moving share price.
If the Cross SMA 50/200 value is less than 1, this shows that the 50 day moving average is below the 200 day moving average (a death cross), is a sell signal as the stock prices has fallen and may continue to drop.
This is what it looks like
This is how you can use one of the four funnels to select companies golden cross companies using the screener:
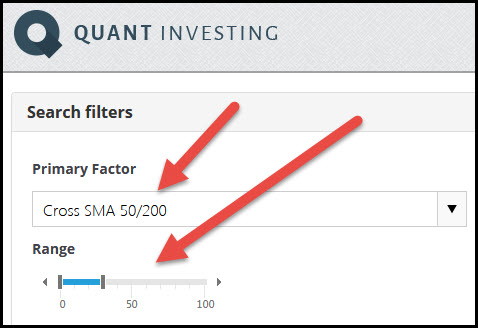
How to select golden cross companies
How to select golden cross companies
To select companies where the 50 day moving average is higher than 200 day moving average position the sliders from 0% to 30%.
To select companies where the 50 day moving average is below the 200 day moving average set the sliders from 70% to 100%.
To find companies where a golden or death cross has just taken place (the 50 day moving average has just crossed the 200 day moving average) set the sliders from 30% to 70%.
| What you want to find | Slider setting |
|---|---|
| Golden-cross companies (50-day above 200-day) | 0% to 30% |
| A cross that has just happened | 30% to 70% |
| Death-cross companies (50-day below 200-day) |
70% to 100% |
| Cross SMA 50/200 value | What it shows | Signal |
|---|---|---|
| Greater than 1 | 50-day moving average above the 200-day | Golden cross (buy) |
| Equal to 1 | 50-day equals the 200-day | Cross forming |
| Less than 1 | 50-day moving average below the 200-day | Death cross (sell) |
Source: Quant Investing stock screener — Cross SMA 50/200 indicator.
See the golden cross values
You can of course also see the golden cross values of the companies in your screen.
To do this click on the Choose columns button and select Cross SMA 50/200 as one of your output columns.
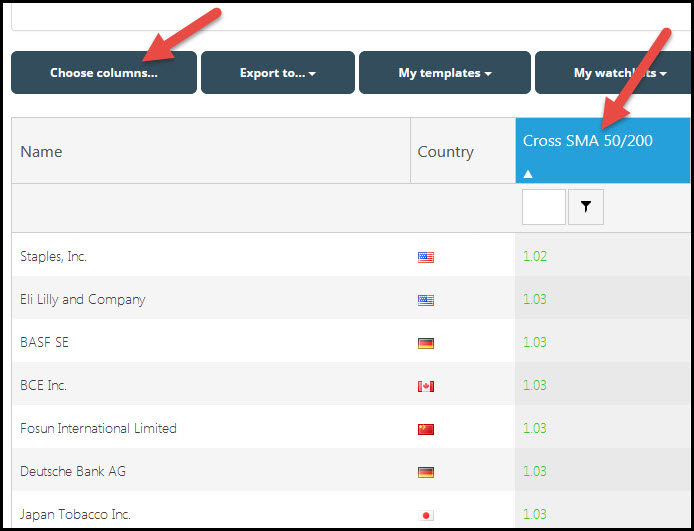
Show the golden cross values of all the companies in your screen
How to sort the column
Clicking on the column heading (Cross SMA 50/200 in this case) sorts the values in the column. If you click once it sorts from low to high, when you click the second time it sorts the column from high to low.
Golden cross also available for world markets and ETFs
As a subscriber you also have access to golden cross indicators applied to 42 world stock markets and 43 ETF’s.
These two reports allow you to quickly see what the major market and market sectors are doing.
Here is an extract of both reports (updated weekly):
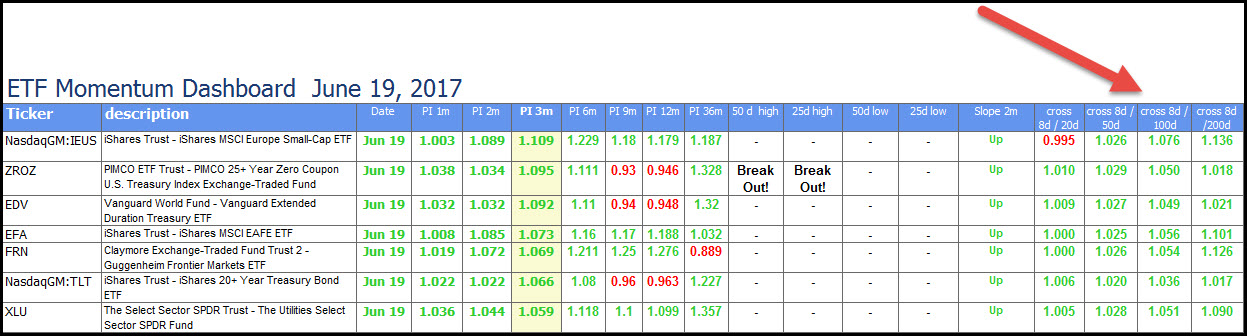
ETF momentum dashboard including golden cross indicators
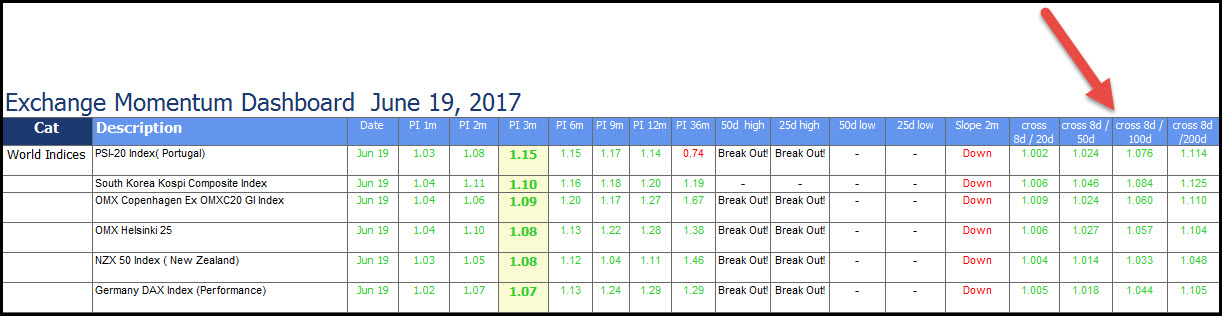
World market momentum dashboard including golden cross indicators
Summary and conclusion
The golden cross and death cross are simple and easy to use indicators to help you time your buy and sell decisions – especially if you are more of a trader.
That said it can also help you if you are a long term investors as it can help you time your buy and sell decisions better.
For example, buy an already researched investment idea on a golden cross and wait for the price to turn up again after a death cross before buying.
Test the golden cross yourself in five minutes
The demo runs on data from a year ago, so it shows you exactly which companies had a golden cross (Cross SMA 50/200 above 1) or a fresh cross (slider 30%–70%) twelve months ago — and which sat in a death cross. Pick any five, look up today's prices, and you have run a real one-year forward test of the signal: did the golden-cross names actually rise and the death-cross names fall? No back-test software needed. When you subscribe, the same screen runs on this week's data, so you can time an already-researched buy or sell the same way going forward.
Forward-test the golden cross now
No credit card needed. Cancels automatically after 30 days.
Already convinced? Skip the demo and subscribe direct — 100% money-back guarantee for the first 30 days. -> See subscription options
Frequently Asked Questions
1. What is a Golden Cross, and why should I care?
The Golden Cross happens when a short-term moving average (like 50 days) crosses above a long-term moving average (like 200 days). It's a strong sign that a stock's price might keep rising, so it's a good time to consider buying.
2. Can the Golden Cross really help me make better investment decisions?
Yes, it can. While no indicator is perfect, the Golden Cross is well-known for signalling potential upward trends, which can help you time your buys more effectively.
3. How do I know when a Golden Cross is happening?
Track the ratio of the two moving averages. In the screener this is Cross SMA 50/200 = 50-day moving average ÷ 200-day moving average: a value above 1 means the 50-day is above the 200-day (golden cross), below 1 means a death cross. To find stocks where the cross has just happened, set the slider from 30% to 70%.
4. Should I use the Golden Cross for all my investments?
It is most effective on larger, more stable companies and less reliable on small, volatile stocks. In a back-test on Apple and Tesla it reduced the worst drawdown but underperformed simply holding, so it is best used to time an already-researched decision rather than as a stand-alone system. It is available across 42 world stock markets and 43 ETFs, updated weekly.
5. What’s the difference between a Golden Cross and a Death Cross?
A Golden Cross signals a potential upward trend (buy signal), while a Death Cross signals a potential downward trend (sell signal).
6. How does the Golden Cross compare to other indicators?
It is one of the simplest trend signals — a single ratio, Cross SMA 50/200, above 1 (golden cross) or below 1 (death cross). Because it lags price by design, it is best combined with your own research and used to time an already-made buy or sell decision rather than on its own.
7. Can the Golden Cross help me avoid bad investments?
It can help you avoid buying into a stock that’s on a downward trend. If you see a Death Cross forming, it might be a signal to wait or sell.
8. Is the Golden Cross a good strategy for long-term investors?
Yes, even long-term investors can use it to time their entry points, potentially buying stocks when a new upward trend begins.
9. What should I do if the stock I own forms a Death Cross?
Consider selling or holding off on additional purchases until the trend reverses. It could signal further price drops.
10. Can I automate trading using the Golden Cross?
Many trading platforms allow you to set up automated alerts or trades when a Golden Cross occurs, making it easier to act quickly on these signals.
Click here to start using the Golden Cross in your portfolio NOW!