
If you're looking for the best Free Cash Flow Yield stock picks for 2025, we’ve got you covered.
Our latest research highlights top global investment ideas, spanning North America, Europe, and Asia. Plus, we’ll show you how to refine this strategy and seamlessly integrate it into your portfolio.
Click here to explore the full list of high Free Cash Flow Yield stocks for 2025.
Estimated Reading Time: 8 minutes
Looking for top-notch Free Cash Flow Yield stock picks for 2024?
In this article we unpack the best Free Cash Flow Yield stock ideas from across the globe, including North America, Europe, and Asia. Plus, we will show you how to enhance the strategy and seamlessly integrate it into your portfolio.
If you're eager to jump straight to the stock suggestions, feel free to skip ahead.
Why free cash flow yield is a great investment strategy
Understanding Free Cash Flow Yield as an investment strategy can significantly improve your stock selection. This is because it focuses on finding companies that are not just undervalued but also have strong cash generation relative to their market value and debt.
Free Cash Flow Yield gives you transparent view of a company because it focuses on the real cash a company produces after covering its expenses and investments. Cash flow is also hard to manipulate. After all cash in the beginning of the year plus or minus cash generated must be equal to cash in the bank on year end.
But how effective is this strategy across various markets and periods?
Let’s explore how Free Cash Flow Yield works, why it's considered a robust metric for valuing companies, and its practical application in your portfolio.
Click here to get the tools you need to implement a high FCF yield strategy in your portfolio
Does free cash flow yield investing work in the USA?
First let’s find out if free cash flow yield works in the USA.
Luckily the great guys at Alpha Architect tested not just free cash flow yield but also normalized (average) valuation ratios in a paper called Analysing Valuation Measures: A Performance Horse-Race over the past 40 Years written by Wes Gray and Jack Vogel.
5 strategies tested over 40 years
They tested 5 ratios over the 40 year period from 1 July 1971 to 31 December 2010 to find the best valuation ratio.
They also tested normalized (average) ratios to see if they increase returns.
What ratios did they test?
- Earnings to Market Value (E/M) – You can also call the ratio Earnings to Price – the inverse of the PE ratio
- Earnings before interest and taxes and depreciation and amortization to total enterprise value (EBITDA/TEV)
- Free cash flow to total enterprise value (FCF/TEV) – FCF was defined as Net Income + Depreciation and Amortization - Working Capital Change - Capital Expenditures
- Gross profits to total enterprise value (GP/TEV)
- Book to market(B/M) – the inverse of Price to Book
Companies included and how they tested
- This back test excluded financial companies and utilities, and the smallest 10% of market value companies listed on the NYSE.
- Portfolios were put together on 30 June each year when all the companies were sorted into five quintiles – 20% groups of companies.
- They only included companies for which 8 years of data was available.
- Portfolios were re-balanced on a yearly basis.
How the ratios were calculated
For the one year (1yr) ratios companies were selected based on current numerator (top value) and current denominator (bottom value) for each measure.
For all the normalized ratios (2 years – 8 years) they used the average of the numerator over the past 2 to 8 years, and divided this average by the current denominator.
For example, the 8 year FCF/EV ratio was calculated using the average of the past 8 years FCF for each company (including the current year), and dividing this by the company’s current total enterprise value (EV).
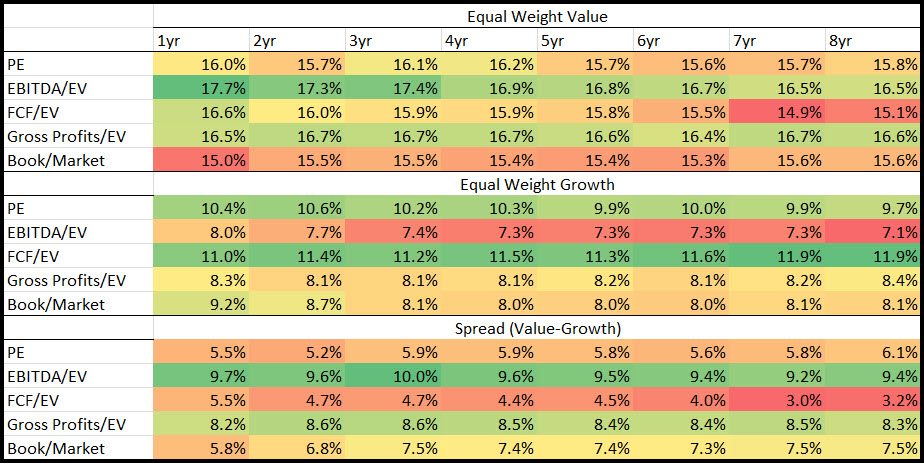
This is what they found:
Click image to enlarge
Source: Analyzing Valuation Measures: A Performance Horse-Race over the past 40 Years.
The Equal Weight Value part of the table shows the equal-weighted returns of the most undervalued (cheap) 20% of companies based on each valuation ration.
The Equal Weight Growth part of the table shows the equal-weighted returns of the most overvalued (expensive) 20% of companies based on each valuation ration.
The Spread (Value-Growth) part of the table shows the difference between the Equal Weight Value and Equal Weight Growth returns of the two above tables.
What they found
As you can see (look at the dark green areas of the table) they did not find that using normalized ratios can add to your returns. Only normalized book to market (inverse of price to book) would have given you slightly higher returns compared to the one year ratio.
The best valuation ratio they found was trailing 12 month EBITDA to EV with an average return of 17.7% over the 40 year test period.
EBITDA to EV was also the ratio the highest spread (Value – Growth) returns which is a further indicator that it is the best ratio to use.
What about free cash flow yield? - Second best ratio
As you can see free cash flow yield was the second best ratio they tested, at 16.6% (look at 1 year equal weight) it was 1.1% per year lower than EBITDA/EV.
Still a great return!
Click here to get the tools you need to implement a high FCF yield strategy in your portfolio
Does free cash flow yield investing work in Europe?
In our book Quantitative Value Investing in Europe: What Works for Achieving Alpha we tested 168 investment strategies in Europe over the 12 year period from June 1999 to June 2011 we also tested 12 months Free Cash Flow yield and 5 year average free cash flow yield.
Free cash flow yield vs Normalized free cash flow yield
In the back test free cash flow yield was defined cash flow from operations minus capital expenditure, divided by enterprise value.
This is what we found:
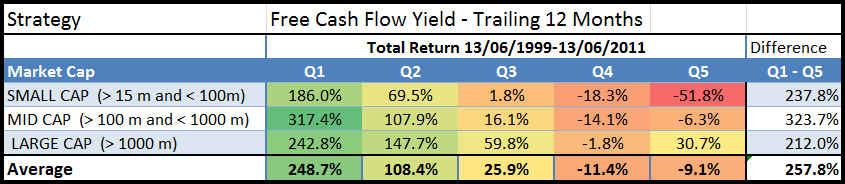
Free Cash Flow Yield Trailing 12 months returns (Source: Quantitative Value Investing in Europe: What Works for Achieving Alpha)
Q1 (Quintile 1) represents the cheapest 20% of companies and Q5 (quintile 5) the most expensive.
As you can see buying the most undervalued FCF yield companies (Q1) gave you by far the best performance, for small mid and large companies.
Substantial market outperformance
Just in case you were wondering - market outperformance was substantial, over the 12-year period of the study, the market portfolio generated a return of only 30.5 % or 2.25% pa, dividends included.
How you can improve the returns of a free cash flow yield investment strategy
In the above research report we not only tested single valuation ratios, we also tested if you can improve returns further by combining free cash flow yield with other ratios.
Improve your free cash flow yield returns
The following table shows you the returns you could have achieved if you can combined high 12 month free cash flow yield companies with other ratios and indicators.
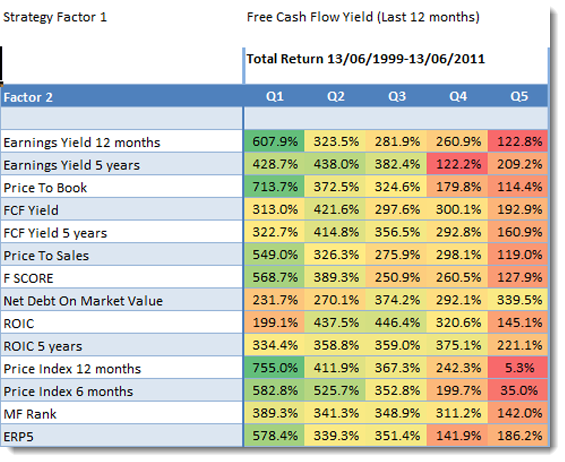
Source: Quantitative Value Investing in Europe: What works for achieving alpha
Look at column Q1
Look at the returns in column Q1, it shows the returns generated by first selecting the 20% best free cash flow yield companies combined with the ratios in the column called Factor 2.
Best combination +755% was Momentum (506.3% improvement)
As you can see the best way to increase your return (+755.0%) was to combine free cash flow yield with Price Index 12 months (12 months momentum).
Price index 12 months is calculated as the current share price / share price 12 months ago.
This means if you invested only in the 20% of high free cash flow yield companies that also had the top 20% 12 months price index you could have increased your return by 506.3% (755.0% - 248.7%) compared to if you only invested in companies with the highest free cash flow yield.
That is an improvement of just over 2 times the original return!
Click here to get the tools you need to implement a high FCF yield strategy in your portfolio
Best Free Cash Flow Yield investing ideas world-wide for 2024
Stand alone Free Cash Flow Yield investment ideas
This is what the screen looked like:
- All countries world-wide included
- Top 20% Free Cash Flow Yield companies
- Minimum daily trading volume of $100,000
- Minimum company market value of $100 million
- Financial statements updated in the last 6 months
- Results sorted by Free Cash Flow Yield from undervalued to expensive
There were some wild numbers (most likely outliers) that ranked best so I went down the list a bit to show you companies with more realistic Free cash flow yields.
| Name | Country | FCF Yield |
|---|---|---|
| HS Holdings Co., Ltd. | Japan | 273.66% |
| Maha Energy AB (publ) | Sweden | 130.15% |
| Offerpad Solutions Inc. | USA | 126.89% |
| Opendoor Technologies Inc. | USA | 105.77% |
| It'S Hanbul Co., Ltd. | South Korea | 88.68% |
| OKEA ASA | Norway | 73.66% |
| Immsi S.p.A. | Italy | 68.73% |
| BioNTech SE | Germany | 68.21% |
| Muhak Co., Ltd. | South Korea | 68.03% |
| F.C.C. Co., Ltd. | Japan | 61.69% |
| Nice Information & Telecommunication, Inc. | South Korea | 55.33% |
| Lock&Lock Co., Ltd. | South Korea | 50.40% |
| mPLUS Corp. | South Korea | 50.05% |
| Abitare In S.p.A. | Italy | 49.77% |
| Foster Electric Company, Limited | Japan | 48.26% |
| Daechang Forging Co., Ltd. | South Korea | 43.36% |
| DY Power Corporation | South Korea | 43.34% |
| Snt Dynamics Co.,Ltd. | South Korea | 43.11% |
| Esprinet S.p.A. | Italy | 42.20% |
| LOTTE Fine Chemical Co., Ltd. | South Korea | 42.18% |
Free Cash Flow Yield combined with Price Index 6 month
This is what the screen looked like:
- All countries world-wide included
- Top 20% Free Cash Flow Yield companies
- Minimum daily trading volume of $100,000
- Minimum company market value of $100 million
- Financial statements updated in the last 6 months
- Results sorted by Price Index 6 months (Momentum) from best to worse
| Name | Country | FCF Yield | Price Index 6m |
|---|---|---|---|
| DOF Group ASA | Norway | 4.4% | 89.9 |
| Shanghai Zhenhua Heavy Industries Co., Ltd. | China | 5.7% | 13.8 |
| Shanghai Jin Jiang International Hotels Co., Ltd. | China | 7.9% | 13.7 |
| Huadian Energy Company Limited | China | 7.7% | 11.3 |
| Shanghai Yaohua Pilkington Glass Group Co., Ltd. | China | 4.4% | 11.0 |
| Inner Mongolia ERDOS Resources Co.,Ltd. | China | 8.1% | 9.6 |
| Hainan Airlines Holding Co., Ltd. | China | 5.1% | 6.7 |
| GigaCloud Technology Inc. | USA | 7.7% | 3.1 |
| MoneyLion Inc. | USA | 13.1% | 3.0 |
| Changhong Meiling Co., Ltd. | China | 19.2% | 2.9 |
| PBA Holdings Bhd | Malaysia | 5.3% | 2.9 |
| Dave Inc. | USA | 5.1% | 2.8 |
| Porch Group, Inc. | USA | 9.9% | 2.8 |
| Abercrombie & Fitch Co. | USA | 6.9% | 2.8 |
| SK-Electronics CO.,LTD. | Japan | 8.7% | 2.6 |
| Energy Services of America Corporation | USA | 7.3% | 2.6 |
| SCREEN Holdings Co., Ltd. | Japan | 7.2% | 2.4 |
| Synopex Inc. | South Korea | 4.8% | 2.3 |
| Höegh Autoliners ASA | Norway | 20.7% | 2.2 |
| RamacoResources, Inc. | USA | 5.4% | 2.1 |
Best Free Cash Flow Yield investment ideas in North America for 2024
Stand alone Free Cash Flow Yield investment ideas
This is what the screen looked like:
- USA and Canada selected
- Top 20% Free Cash Flow Yield companies
- Minimum daily trading volume of $100,000
- Minimum company market value of $100 million
- Financial statements updated in the last 6 months
- Results sorted by Free Cash Flow Yield from undervalued to expensive
| Name | Country | FCF Yield |
|---|---|---|
| Offerpad Solutions Inc. | USA | 126.89% |
| Opendoor Technologies Inc. | USA | 105.77% |
| Teekay Corporation | USA | 40.75% |
| The Andersons, Inc. | USA | 40.25% |
| Fortitude Gold Corporation | USA | 36.49% |
| PetroTal Corp. | USA | 33.09% |
| Cross Country Healthcare, Inc. | USA | 32.45% |
| Zymeworks Inc. | Canada | 30.83% |
| Teekay Tankers Ltd. | USA | 30.81% |
| CarParts.com, Inc. | USA | 30.52% |
| Dundee Precious Metals Inc. | Canada | 30.03% |
| Westlake Chemical Partners LP | USA | 29.31% |
| Hamilton Beach Brands Holding Company | USA | 28.95% |
| BlueLinx Holdings Inc. | USA | 28.42% |
| Cricut, Inc. | USA | 28.14% |
| Medifast, Inc. | USA | 27.97% |
| Neo Performance Materials Inc. | Canada | 27.92% |
| Spartan Delta Corp. | Canada | 27.89% |
| G-III Apparel Group, Ltd. | USA | 26.26% |
| Amplify Energy Corp. | USA | 25.96% |
Free Cash Flow Yield combined with Price Index 6 month
This is what the screen looked like:
- USA and Canada selected
- Top 20% Free Cash Flow Yield companies
- Minimum daily trading volume of $100,000
- Minimum company market value of $100 million
- Financial statements updated in the last 6 months
- Results sorted by Price Index 6 months (Momentum) from best to worse
| Name | Country | FCF Yield | Price Index 6m |
|---|---|---|---|
| GigaCloud Technology Inc. | USA | 7.7% | 3.1 |
| MoneyLion Inc. | USA | 13.1% | 3.0 |
| Dave Inc. | USA | 5.1% | 2.8 |
| Porch Group, Inc. | USA | 9.9% | 2.8 |
| Abercrombie & Fitch Co. | USA | 6.9% | 2.8 |
| Energy Services of America Corporation | USA | 7.3% | 2.6 |
| Ramaco Resources, Inc. | USA | 5.4% | 2.1 |
| Vitalhub Corp. | Canada | 5.6% | 2.0 |
| ADF Group Inc. | Canada | 9.0% | 2.0 |
| The Gap, Inc. | USA | 8.8% | 2.0 |
| Alpha Metallurgical Resources, Inc. | USA | 12.7% | 2.0 |
| AdTheorent Holding Company, Inc. | USA | 6.4% | 2.0 |
| Taylor Devices, Inc. | USA | 16.4% | 2.0 |
| SurgePays, Inc. | USA | 8.8% | 1.9 |
| JAKKS Pacific, Inc. | USA | 23.6% | 1.8 |
| Celestica Inc. | Canada | 5.7% | 1.8 |
| Pactiv Evergreen Inc. | USA | 5.5% | 1.8 |
| NerdWallet, Inc. | USA | 5.4% | 1.7 |
| Converge Technology Solutions Corp. | Canada | 9.7% | 1.7 |
| Hamilton Beach Brands Holding Company | USA | 28.9% | 1.7 |
Best Free Cash Flow Yield investment ideas in Europe for 2024
Standalone Free Cash Flow Yield investment ideas
This is what the screen looked like:
- EU countries, Scandinavia and the UK selected
- Top 20% Free Cash Flow Yield companies
- Minimum daily trading volume of $100,000
- Minimum company market value of $100 million
- Financial statements updated in the last 6 months
- Results sorted by Free Cash Flow Yield from undervalued to expensive
| Name | Country | FCF Yield |
|---|---|---|
| Maha Energy AB (publ) | Sweden | 129.3% |
| OKEA ASA | Norway | 73.7% |
| Immsi S.p.A. | Italy | 68.7% |
| BioNTech SE | Germany | 68.0% |
| Abitare In S.p.A. | Italy | 49.8% |
| Esprinet S.p.A. | Italy | 42.2% |
| TGS ASA | Norway | 38.9% |
| CTT - Correios De Portugal, S.A. | Portugal | 34.8% |
| VEON Ltd. | The Netherlands | 31.4% |
| MFE-Mediaforeurope N.V. | Italy | 30.7% |
| Enad Global 7 AB (publ) | Sweden | 30.5% |
| MPC Container Ships ASA | Norway | 30.2% |
| trivago N.V. | Germany | 28.7% |
| Digital Bros S.p.A. | Italy | 28.6% |
| Obrascón Huarte Lain, S.A. | Spain | 28.4% |
| Severfield plc | Great Britain | 28.2% |
| BHG Group AB (publ) | Sweden | 27.1% |
| Cliq Digital AG | Germany | 26.9% |
| IG Design Group plc | Great Britain | 25.6% |
| PGS ASA | Norway | 25.4% |
Free Cash Flow Yield combined with Price Index 6 month
This is what the screen looked like:
- EU countries, Scandinavia and the UK selected
- Top 20% Free Cash Flow Yield companies
- Minimum daily trading volume of $100,000
- Minimum company market value of $100 million
- Financial statements updated in the last 6 months
- Results sorted by Price Index 6 months (Momentum) from best to worse
| Name | Country | FCF Yield | Price Index 6m |
|---|---|---|---|
| Höegh Autoliners ASA | Norway | 20.6% | 2.2 |
| Zinzino AB (publ) | Sweden | 7.8% | 2.0 |
| Intralot S.A. | Greece | 6.9% | 2.0 |
| Wincanton plc | Great Britain | 12.2% | 1.8 |
| Kid ASA | Norway | 9.1% | 1.8 |
| Sats ASA | Norway | 13.8% | 1.7 |
| RVRC Holding AB (publ) | Sweden | 6.4% | 1.7 |
| Ambea AB (publ) | Sweden | 10.3% | 1.7 |
| Clas Ohlson AB (publ) | Sweden | 13.7% | 1.6 |
| Stolt-Nielsen Limited | Great Britain | 14.4% | 1.6 |
| PDD Holdings Inc. | Ireland | 6.5% | 1.6 |
| Klaveness Combination Carriers ASA | Norway | 13.7% | 1.6 |
| Odfjell SE | Norway | 12.0% | 1.6 |
| Knights Group Holdings plc | Great Britain | 8.0% | 1.6 |
| d'Amico International Shipping S.A. | Luxembourg | 19.1% | 1.6 |
| De La Rue plc | Great Britain | 8.4% | 1.5 |
| Alleima AB (publ) | Sweden | 8.4% | 1.5 |
| Sogefi S.p.A. | Italy | 8.1% | 1.5 |
| Solstad Offshore ASA | Norway | 9.2% | 1.5 |
| Norwegian Air Shuttle ASA | Norway | 14.4% | 1.5 |
Best Free Cash Flow Yield investment ideas in Asia for 2024
Stand alone Free Cash Flow Yield investment ideas
This is what the screen looked like:
- Australia, China, Hong Kong, Japan, South Korea, New Zealand and Singapore selected
- Top 20% Free Cash Flow Yield companies
- Minimum daily trading volume of $100,000
- Minimum company market value of $100 million
- Financial statements updated in the last 6 months
- Results sorted by Free Cash Flow Yield from undervalued to expensive
| Name | Country | FCF Yield |
|---|---|---|
| HS Holdings Co., Ltd. | Japan | 273.7% |
| It'S Hanbul Co., Ltd. | South Korea | 88.7% |
| Muhak Co., Ltd. | South Korea | 68.0% |
| F.C.C. Co., Ltd. | Japan | 61.7% |
| Nice Information & Telecommunication, Inc. | South Korea | 55.3% |
| Lock&Lock Co., Ltd. | South Korea | 50.4% |
| mPLUS Corp. | South Korea | 50.1% |
| Foster Electric Company, Limited | Japan | 48.3% |
| Daechang Forging Co., Ltd. | South Korea | 43.4% |
| DY Power Corporation | South Korea | 43.3% |
| Snt Dynamics Co.,Ltd. | South Korea | 43.1% |
| LOTTE Fine Chemical Co., Ltd. | South Korea | 42.2% |
| Daehan Steel Co., Ltd. | South Korea | 41.3% |
| WiSoL CO.,LTD. | South Korea | 41.1% |
| Grindrod Shipping Holdings Ltd. | Singapore | 40.4% |
| Nakano Corporation | Japan | 39.6% |
| WONIK Materials Co.,Ltd. | South Korea | 37.4% |
| Sammok S-Form Co.,Ltd | South Korea | 36.4% |
| Ubiquoss Inc. | South Korea | 35.3% |
| BAIC Motor Corporation Limited | China | 35.1% |
Free Cash Flow Yield combined with Price Index 6 month
This is what the screen looked like:
- Australia, China, Hong Kong, Japan, South Korea, New Zealand and Singapore selected
- Top 20% Free Cash Flow Yield companies
- Minimum daily trading volume of $100,000
- Minimum company market value of $100 million
- Financial statements updated in the last 6 months
- Results sorted by Price Index 6 months (Momentum) from best to worse
| Name | Country | FCF Yield | Price Index 6m |
|---|---|---|---|
| Shanghai Zhenhua Heavy Industries Co., Ltd. | China | 5.7% | 13.8 |
| Shanghai Jin Jiang International Hotels Co., Ltd. | China | 7.9% | 13.7 |
| Huadian Energy Company Limited | China | 7.7% | 11.3 |
| Inner Mongolia ERDOS Resources Co.,Ltd. | China | 8.1% | 9.6 |
| Shanghai Shenqi Pharmaceutical Investment Management Co., Ltd. | China | 7.1% | 8.4 |
| Hainan Airlines Holding Co., Ltd. | China | 5.1% | 6.7 |
| Changhong Meiling Co., Ltd. | China | 19.2% | 2.9 |
| SK-Electronics CO.,LTD. | Japan | 8.7% | 2.6 |
| SCREEN Holdings Co., Ltd. | Japan | 7.2% | 2.4 |
| Marusan Securities Co., Ltd. | Japan | 7.2% | 1.9 |
| Welbe, Inc. | Japan | 7.0% | 1.9 |
| HDC Hyundai Development Company | South Korea | 8.8% | 1.8 |
| Bengang Steel Plates Co., Ltd. | China | 10.7% | 1.8 |
| T.RAD Co., Ltd. | Japan | 8.6% | 1.8 |
| Lock&Lock Co., Ltd. | South Korea | 50.4% | 1.8 |
| New Oriental Education & Technology Group Inc. | China | 5.4% | 1.7 |
| Daewoong Co., Ltd. | South Korea | 6.3% | 1.7 |
| Snt Dynamics Co.,Ltd. | South Korea | 43.1% | 1.6 |
| Agabang&Company | South Korea | 9.1% | 1.6 |
| Tera Probe, Inc. | Japan | 5.8% | 1.6 |
How to find Free Cash Flow Yield investment ideas
Now for the interesting part where you can see exactly how to find free cash flow yield investment ideas for your portfolio.
We have saved a free cash flow yield screen for you so all you have to do is load it.
Here is how you do it:
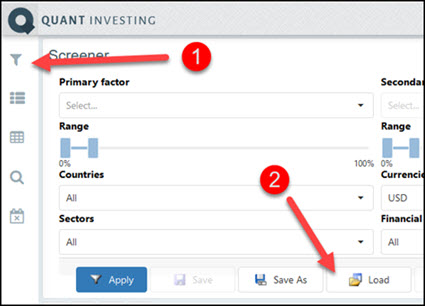
After logging into the screener click
- The Screener funnel icon
- Then click the Load button
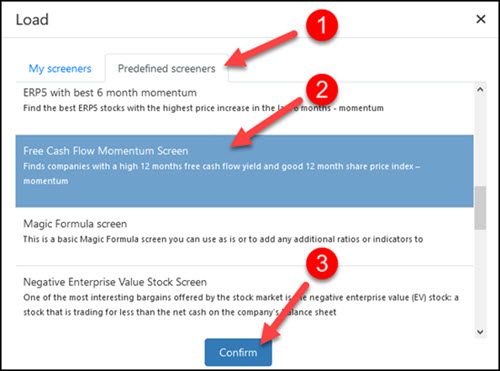
- Then click on the Predefined screeners tab, scroll down then
- Click on the Free Cash Flow Momentum Screen
- Click the Confirm button
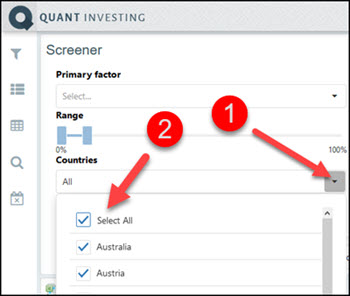
Select your countries
You then have to select the countries where you would like to search for investment ideas.
To do this:
- Click the drop down list item below Countries and then
- Check all the countries you would like to select
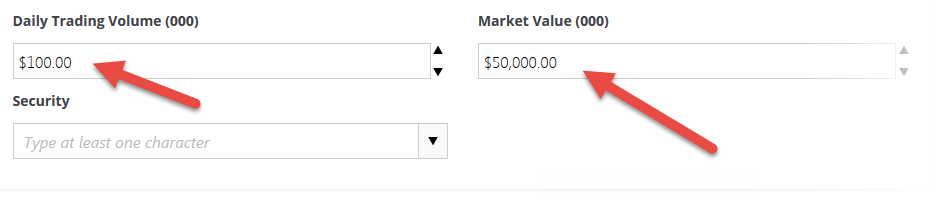
Select value and volume
Next you have to enter the minimum daily trading volume and the minimum market value of the companies you want to screen for.
Important: The numbers you enter are in thousands, this means if you enter $100 it is equal to $100,000.
That is all you have to do.
When you are done click the Apply button to get your investment ideas.
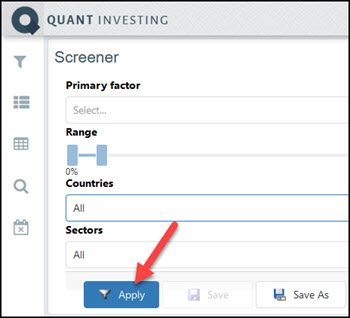
That is all there is to do
That is all you must do to start finding your own high Free Cash Flow investment ideas!
Click here to get the tools you need to implement a high FCF yield strategy in your portfolio
You can save all your screens
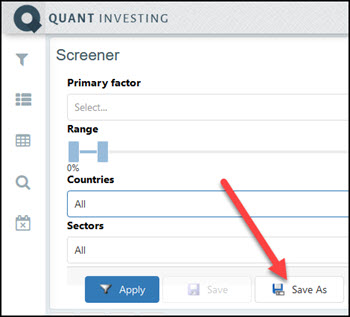
Once you have changed the basic free cash flow yield screen to fit your investment style you can save it so that you can call it up at any time with a few simple mouse clicks.
You can save as many screens as you like.
To save your screen click the Screener funnel icon, then the Save As button to save your screen.
All this costs less than a lunch for two
How much does a tool like this cost, you may be thinking?
To make it affordable, and give you a great return on your investment, even if your portfolio is still small, we have made the price of the screener surprisingly low.
It costs less than an inexpensive lunch for two each month (Click here to sign up RIGHT NOW!).
Don’t hesitate, you have nothing to lose. If you are not 100% satisfied you get your money back – no questions asked!
PS: Why not sign up right now, while this is fresh in your mind?
Frequently Asked Questions
1. What is free cash flow yield?
It's the cash a company has left after paying for its operations and investments, divided by its total market value (including debt and cash). It shows how much cash a company generates compared to its total value.
2. Why should I care about free cash flow yield?
Free cash flow is hard to fake. It tells you if a company is truly making money, which is crucial for long-term investing.
3. Is free cash flow yield better than other ratios?
It's one of the best because it focuses on real cash. Some studies even show it's almost as good as the best metric, EBIT/EV.
4. Can I use free cash flow yield in any market?
Yes! Whether in the USA, Europe, or Asia, high free cash flow yield stocks have shown to perform well.
5. How do I find stocks with high free cash flow yield?
You can use stock screeners that sort companies by their free cash flow yield. Look for those in the top 20%.
6. What other metrics should I combine with free cash flow yield?
Combining it with momentum (how much a stock’s price has increased over the past year) can boost returns even more.
7. Are there risks with free cash flow yield investing?
Like all investments, it has risks. Sometimes, high yields can be due to temporary issues or wild working capital movements. Always do your own research.
8. How often should I review my free cash flow yield stocks?
Annually rebalancing your portfolio is a good practice. This ensures you keep up with changes in the companies you invest in.
9. What are the best regions for free cash flow yield stocks?
Good opportunities exist worldwide, look at regions where you're comfortable investing.
10. Should I buy only high free cash flow yield stocks?
It’s a good strategy, but diversify with other metrics or different types of stocks to manage risk.
Click here to get the tools you need to implement a high FCF yield strategy in your portfolio
