

In the article Quality, value, momentum – the best strategy you have never heard of, I told you about an investment strategy that uses the best ideas from our 2012 research paper Quantitative Value Investing in Europe: What works for achieving alpha as well as all the research we have done up till the end of 2014.
In the article we tested the investment strategy in Europe and a lot of readers asked if the investment strategy worked as well in North America.
We ran the back test again on North American companies and this article is a summary of what we found.
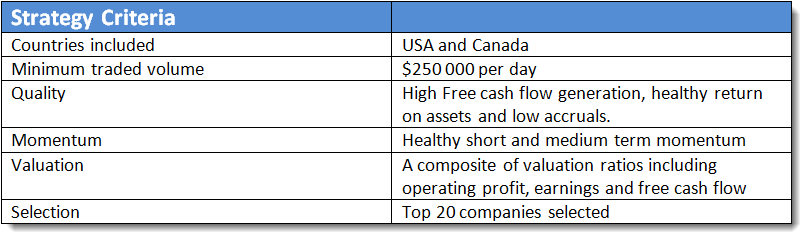
This is how the companies are selected:
Click image to enlarge
How are the companies selected?
Quality
The first thing we do is remove all the low quality businesses from the list of possible investment ideas.
First - remove companies that generate a low level of free cash flow to total debt (a company must generate cash profits in order to repay its debt). Use the FCF to debt ratio in one of the sliders in the Quant Investing stock screener and select 0% to 70%.
Second - remove companies that have a low return on assets. Research has shown that companies with a low return on assets don't generate high investment returns. Use the ratio Gross Margin (Marx) and select 0% to 70% with the slider.
Third - remove companies where there's a big difference between the profits and the free cash flow the company generates. Again, because research has shown that companies with free cash flow nearly equal to profits (low level of accruals) give you much higher returns. Use the ratio Accrual Ratio CF and select 30% to 100% with the slider.
Valuation
After removing all the low quality companies we select the top 20% of companies with the highest earnings yield (EBIT to Enterprise value). Use the ratio Earnings Yield and select 0% to 20% with the slider.
Most of the time the simplest ideas lead to the best results, this is definitely true of this valuation ratio as numerous research studies have shown that this is the best valuation ratio you can use to find high return investments.
This is what the screen looks like:
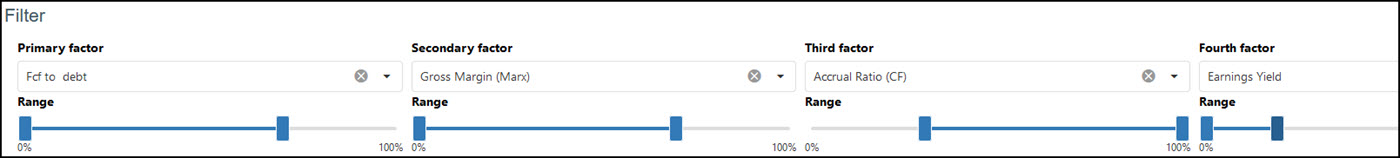
Click to enlarge
Momentum
If there's one fact that came out of the above-mentioned research paper it is that if you want high returns you have to consider share price momentum.
To select investment ideas for the QVM strategy combine 3 month (Price Index 3m) and 6 months (Price Index 6m) share price momentum so that only companies with an upward moving share price are selected.
For both 3 and 6 month Price Index select the top 50% of companies with the top momentum.
To do this you must export the above results to Microsoft Excel.
Best 20 ideas
After you have selected all the above-mentioned criteria, select the 20 most undervalued companies based on Value Composite One rank as defined by James O'Shaughnessy in the fourth edition of his excellent book What Works on Wall Street.
To do this simply sort the Value Composite One column in Excel.
In summary a simple idea
Even though this may seem really complicated the investment strategy it really boils down to the following simple principles:
- Remove bad quality companies
- Look for undervalued companies
- With good share price momentum
- Choose only the most undervalued companies
How did the strategy perform?
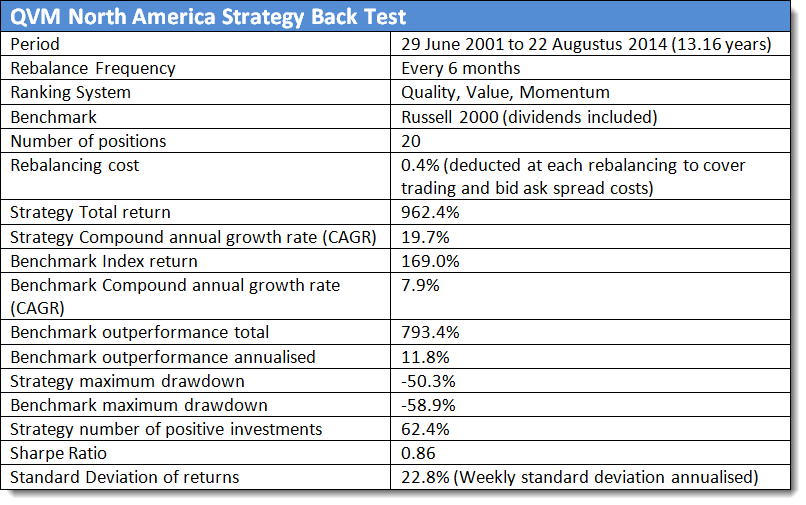
Click image to enlarge
Yearly performance
The table below shows the yearly returns of the QVM North America strategy compared to the Russell 2000 (EOD) Total Return index (which includes dividends):
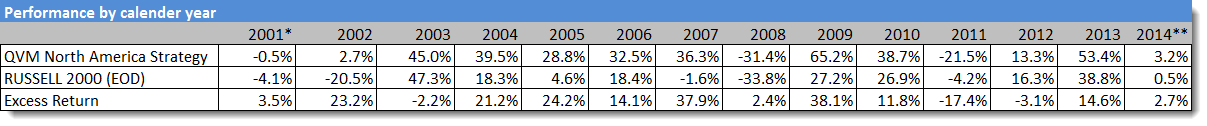
Click image to enlarge
(*) Inception date 29-06-2001
(**) End date 22-08-2014
Growth of your investment in the strategy
This chart shows the growth of investing $1 in the QVM North America strategy compared to if you invested in the Russell 2000 (EOD) Total Return index (dividends included).
$1 grown to $10.62 index only $2.69
As you can see your $1 investment in the QVM North America Strategy would have grown to $10.62.
Compare this to if you invested $1 in the index you would have only had $2.69 after 13 years.
Your $10 000 grown to $106 238
This means if you invested $10 000 in this investment strategy after just more than 13 years you would have had $106 238 in your account.
If you invested the same $10 000 in the index you would have only had $26 899 after 13 years.
This is what your returns would have looked like:
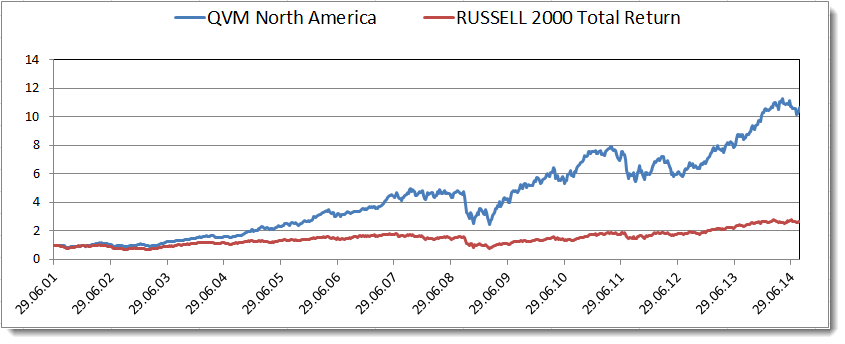
Click image to enlarge
Returns logarithmic scale
This chart below also shows your return of investing €1 in the QVM Strategy and the index but it shows a logarithmic scale to show that the index was even more volatile than the QVM Strategy.
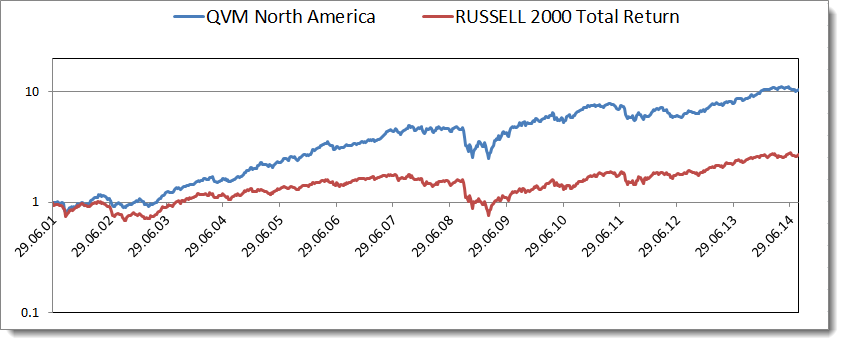
Click image to enlarge
Great returns easy to implement
As you have seen the strategy’s returns are very good and you can be easily implement it using the screener.
To get these returns for your portfolio (for less than an inexpensive lunch for two) why not sign up now by clicking on the following link: Quant Investing join today
It is so easy to put things off, why don't you sign up right now while it is still fresh in your mind?
