

"You only find out who is swimming naked when the tide goes out." - Warren Buffett
There are really only two reasons why companies swim naked and that may lead to you losing your total investment:
- Companies that are cooking the books -> financial statements manipulation and fraud
- Bankruptcy
In most cases these risks are often found together, companies that cook their books also go bankrupt.
Management’s desire to put a positive spin on financial results has been around for a long time. Dishonest companies use tricks to prey on unsuspecting investors, and it is unlikely that they will ever stop doing it.
They are simply bad investments
It is safe to say that companies that manipulation financial statement or commit fraud are terrible investments.
But how can you detect these companies early so that you can avoid them or remove them from your portfolio as early as possible?
Here are a few ideas to help you.
There is a way to find financial shenanigans
The Beneish M-Score
Messod Beneish, an accounting professor at Indiana University's Kelley School of Business, outlined a quantitative approach to detecting financial statement manipulation in his 1999 paper “The Detection of Earnings Manipulation.”
He based his model on forensic accounting principles, calling it the “probability of manipulation”, “PROBM” model or the Beneish M-Score.
This is how he built the model.
As a start Prof Beneish collected a sample of known earnings manipulating companies. Then he identified their main characteristics and used those characteristics to create a model for detecting manipulation.
The M-Score model includes variables that are designed to capture either the effects of manipulation or pre-conditions that may incentivise management to start manipulating results.
It predicts future manipulators
The Beneish M-Score can also predict future financial statement manipulators. In tests the M-Score identified approximately half of the companies involved in earnings manipulation before they were discovered.
The M-Score also correctly identified, ahead of time, 12 of the 17 highest-profile fraud cases in the period 1998 to 2002.
Click here to get the M-Score working in your portfolio NOW!
How is it calculated?
The M score is based on a combination of the following eight different variables:
1. DSRI = Days’ Sales in Receivables Index
Measured as the ratio of days’ sales in accounts receivables in year t (this year) compared to year t-1 (previous year). A large increase in DSR could be indicative of sales manipulation.
2. GMI = Gross Margin Index
Measured as the ratio of gross margin in year t-1 to gross margin in year t.
If this variable is above 1 it means the gross margin has deteriorated. It assumes a company with bad prospects is more likely to manipulate earnings.
3. AQI = Asset Quality Index
Asset quality is measured as the ratio of non-current assets other than plant, property and equipment to total assets.
AQI is the ratio of asset quality in year t to year t-1.
4. SGI = Sales Growth Index
Ratio of sales in year t to sales in year t-1.
Sales growth is not itself a measure of manipulation, however, growth companies are likely to find themselves under pressure to manipulate sales to keep its “growth” image.
5. DEPI = Depreciation Index
Measured as the ratio of the rate of depreciation in year t-1 to the rate in year t.
DEPI greater than 1 indicates that assets are being depreciated at a slower rate. This suggests that the firm might be extending the useful life of its assets thus lowering depreciation and increasing profits.
6. SGAI = Sales, General and Administrative expenses Index
The ratio of SGA expenses in year t relative to year t -1.
7. LVGI = Leverage Index
The ratio of total debt to total assets in year t relative to yeat t-1.
An LVGI >1 indicates an increase in leverage
8. TATA - Total Accruals to Total Assets
Total accruals calculated as the change in working capital (excluding cash) minus depreciation.
The Beneish M Score Formula
The above eight variables are then weighted and added together as follows:
M = -4.84 + 0.92*DSRI + 0.528*GMI + 0.404*AQI + 0.892*SGI + 0.115*DEPI – 0.172*SGAI + 4.679*TATA – 0.327*LVGI
Larger than -2.22 is bad
A score greater than -2.22 indicates a strong likelihood of a company being a manipulator.
If the M-Score = -999
If the M-Score is -999 it means that some values were missing and it could not be calculated.
How the M-Score can help your returns
In a back test the Beneish M-Score also consistently improved stock returns from 1993 to 2007. During this 15-year period stocks that were identified as potential earnings manipulators by the M-Score returned 9.7% less than stocks that were not identified.
Interestingly, students from Cornell University using the Beneish M-Score correctly identified Enron as an earnings manipulator, while experienced financial analysts failed to do so.
Click here to get the M-Score working in your portfolio NOW!
Where to find it in the screener?
It is very easy to use the Beneish M-Score when looking for ideas in the Quant Investing stock screener.
Simply select M-Score (Beneish) as one of the output columns of your screen. You can then use the filter function (click the funnel icon) to screen out companies with a bad Beneish M-Score.
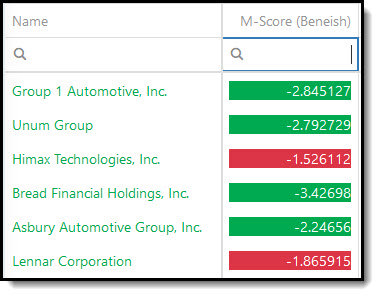
Source: Quant investing screener
These companies may go bankrupt
Altman Z-score
The Altman Z-Score formula for predicting bankruptcy was published in 1968 by Edward I. Altman, who was, at the time, an Assistant Professor of Finance at New York University.
The formula can be used to predict the probability that a firm will go into bankruptcy within the next two years.
The Z-score uses a few income statement and balance sheet ratios to measure the financial health of a company. You can find more information on how the Altman Z-Score is calculated in the Glossary under the heading Z-Score.
How the Z-Score is interpreted
The Z-Score values in the screener should be interpreted as follows:
Z-score of greater than 2.99 = Safe
Z-score between 1.8 and 2.99 = Middle or grey
Z-score smaller than 1.80 = Distress
The z-Score values in the screener are colour coded to help you to easily interpret its value.
Click here to get the Z-Score working in your portfolio NOW!
The Altman Z-Score in the screener
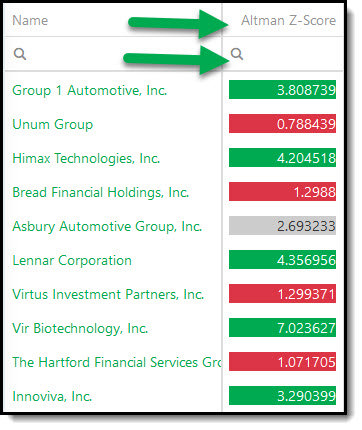
You can easily use the Altman Z-Score in any of your stock screens.
Simply select Altman Z-Score as one of the output columns of your screen. You can then use the filter function (click the funnel icon) to screen out companies with a bad Z-Score of less than 1.80.
You can see in the screenshot below that the z-Score values are colour coded so you can easily see what is good (green), middle is (black) and distress (Red).
To get these indicators working in your portfolio as soon as possible sign up here.
It costs less than an inexpensive lunch for two and if you do not like it you get your money back.
Click here to get the M and Z-Score working in your portfolio NOW!
