
Most investors chase earnings. But earnings can lie. Free cash flow does not.
In a 40-year study of every major valuation ratio, Alpha Architect found that Free Cash Flow Yield ranked as the second-best way to find undervalued stocks — delivering 16.6% average annual returns from 1971 to 2010. Only EBITDA/EV ranked higher, at 17.7%.
That 1.1% gap is worth understanding. EBITDA excludes depreciation and amortisation — but those are real costs for any business that needs physical assets to operate. A factory, a fleet of vehicles, a pipeline: the wear on those assets is a genuine expense. FCF yield accounts for it directly by deducting capital expenditure from operating cash flow. This makes FCF yield the more conservative and reliable measure for most industries, and the reason many practitioners prefer it over EBITDA/EV despite the small return difference.
Our own 12-year European back test confirmed the finding: the top 20% of companies ranked by FCF yield returned 248.7% versus 30.5% for the market over the same period. And when combined with 12-month price momentum, that rose to 755% — more than double the standalone strategy.
This article explains exactly how FCF yield works, why it outperforms, and gives you over 90 high FCF yield investment ideas for 2026 across North America, Europe and Asia.
In this post, you will learn why free cash flow yield works, how you can find ideas fast, and how to use two proven versions of the strategy. You will also get over 90 high free cash flow investment ideas and see how you can use a repeatable screen to find your own high free cash flow ideas with a few mouse clicks.
With the Quant Investing screener, you can set this up, so you get high free cash flow ideas that exactly fit your requirements in your inbox without even having to log into the screener.
To make sure we are talking about the same ratio first a definition:
Free Cash Flow Yield definition: Free Cash Flow Yield = Free Cash Flow ÷ Enterprise Value. Free Cash Flow is cash from operations minus capital expenditure. Enterprise Value is market capitalisation plus long-term debt plus minority interest plus preferred capital minus excess cash. A higher FCF yield indicates a cheaper, more cash-generative company relative to its total value.
Key findings from the research:
- FCF yield ranked second-best of all valuation ratios in a 40-year US study (16.6% average annual return vs 17.7% for EBITDA/EV best)
- Top 20% FCF yield companies in Europe returned 248.7% over 12 years versus 30.5% for the market
- Combined with 12-month price momentum, FCF yield produced +755% over 12 years — more than double the standalone strategy
- Results confirmed in both US (1971–2010) and European markets (1999–2011)
Why Free Cash Flow Yield Is a Great Investment Strategy
Free Cash Flow is the cash a business has left after it pays for what it needs to run, to maintain and grow the business. In the Quant Investing stock screener, Free Cash Flow (FCF) is defined as total cash from operations minus capital expenditure.
Free Cash Flow Yield tells you how much free cash flow you get compared to the full price of the business. In the screener, Free Cash Flow Yield is defined as Free Cash Flow divided by Enterprise Value. Enterprise Value is market cap plus long-term debt plus minority interest plus preferred capital minus excess cash.
As you can see, it is a clean way to find companies that have enough cash to pay dividends and do buybacks. It lets you avoid stocks that only “look cheap” because earnings are high for one year, but the business generated no cash because accounts receivable increased substantially, for example – never a good sign.
Does Free Cash Flow Yield Investing Work
Before you start using the strategy, you should ask one question. Does the strategy work over long periods across different world markets? If it does, you have an advantage.
The reason free cash flow yield investing works is simple. Investors often overpay for growth and exciting stories. They ignore boring, high cash generating companies. Free cash flow yield gives you investment ideas in this ignored group.
It also forces you to be disciplined. You are not buying what feels good today. You are buying what is cheap compared to cash.
FCF Yield Backtest in the USA
Alpha Architect tested all valuation ratios and found FCF Yield to be one of the best. Their 40-year study of valuation ratios was a quest to find the Holy Grail of investing metrics.
Free Cash Flow Yield emerged as one of the best, second only to EBITDA/EV.
They tested 5 ratios over the 40-year period from 1 July 1971 to 31 December 2010 and tested normalised (average) ratios to see if they increase returns.
What ratios did they test?
-
Earnings to Market Value (E/M) – You can also call the ratio Earnings to Price – the inverse of the PE ratio
-
Earnings before interest, taxes, depreciation, and amortization to total enterprise value (EBITDA/TEV)
-
Free cash flow to total enterprise value (FCF/TEV) – FCF was defined as Net Income + Depreciation and Amortization - Working Capital Change - Capital Expenditures
-
Gross profits to total enterprise value (GP/TEV)
-
Book to market(B/M) – the inverse of Price to Book
Companies included and how they tested
-
This back test excluded financial companies and utilities, and the smallest 10% of market value companies listed on the NYSE.
-
Portfolios were put together on 30 June each year when all the companies were sorted into five quintiles, 20% groups of companies.
-
They only included companies for which 8 years of data were available.
-
Portfolios were rebalanced on a yearly basis.
How the ratios were calculated
For the one-year (1yr) ratios, companies were selected based on the current numerator (top value) and current denominator (bottom value) for each measure.
For all the normalized ratios (2 years – 8 years) they used the average of the numerator over the past 2 to 8 years and divided this average by the current denominator.
For example, the 8-year FCF/EV ratio was calculated using the average of the past 8 years FCF for each company (including the current year) and dividing this by the company’s current total enterprise value (EV).
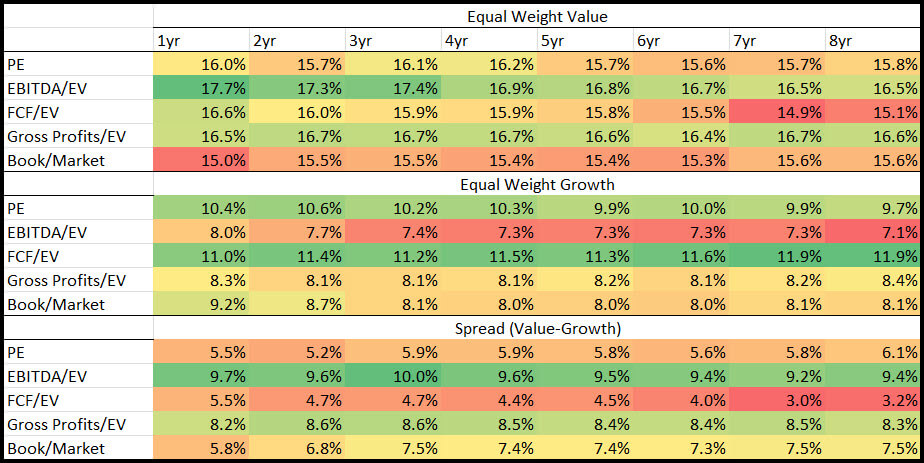
This is what they found:
Click image to enlarge
Source: Analyzing Valuation Measures: A Performance Horse-Race over the past 40 Years.
The Equal Weight Value part of the table shows the equal-weighted returns of the most undervalued (cheap) 20% of companies based on each valuation ratio.
The Equal Weight Growth part of the table shows the equal-weighted returns of the most overvalued (expensive) 20% of companies based on each valuation ratio..
The Spread (Value-Growth) part of the table shows the difference between the Equal Weight Value and Equal Weight Growth returns of the two above tables.
What they found
As you can see (look at the dark green areas of the table) they did not find that using normalised ratios can add to your returns. Only a normalised book-to-market (inverse of price-to-book) would have given you slightly higher returns compared to the one-year ratio.
The best valuation ratio they found was trailing 1 year EBITDA to EV, with an average return of 17.7% over the 40-year test period.
EBITDA to EV was also the ratio with the highest spread (Value – Growth) returns, which is a further indicator that it is the best ratio to use.
What about free cash flow yield? - Second-best ratio
As you can see free cash flow yield was the second-best ratio they tested, at 16.6% (look at 1-year equal weight) it was 1.1% per year lower than EBITDA/EV.
Still a great return!
Key research findings in summary:
- FCF yield ranked second of all valuation ratios in a 40-year US study — 16.6% average annual return versus 17.7% for EBITDA/EV (best)
- Top 20% FCF yield companies in Europe returned 248.7% over 12 years versus 30.5% for the market
- Combined with 12-month price momentum, FCF yield produced +755% over 12 years — more than double the standalone strategy
- Results confirmed in both US (1971–2010) and European markets (1999–2011)
Screen for High Free Cash Flow Yield Stocks Yourself
The screener lets you filter 22,000+ companies across 110+ ratios — including FCF yield, FCF-to-debt, and FCF growth — so you can build and test your own free cash flow screens across global markets.
Try the Free Cash Flow Screener Free for 30 Days
No credit card needed. Cancels automatically after 30 days.
FCF Yield Backtested in Europe
We tested FCF Yield in Europe and found that no matter where you look, high Free Cash Flow Yield companies consistently had great returns.
In our book Quantitative Value Investing in Europe: What Works for Achieving Alpha we tested 168 investment strategies in Europe over the 12 year period from June 1999 to June 2011 we also tested 12 months Free Cash Flow yield and 5 year average free cash flow yield.
Free cash flow yield vs Normalised free cash flow yield
In the back test, free cash flow yield was defined as cash flow from operations minus capital expenditure, divided by enterprise value.
This is what we found:
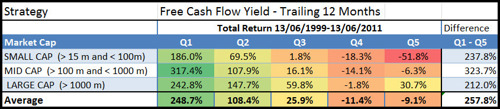
Free Cash Flow Yield Trailing 12 months returns (Source: Quantitative Value Investing in Europe: What Works for Achieving Alpha)
Q1 (Quintile 1) represents the cheapest 20% of companies and Q5 (quintile 5) the most expensive.
As you can see, buying the most undervalued FCF yield companies (Q1) gave you by far the best performance, for small mid and large companies.
Substantial market outperformance
Just in case you were wondering - market outperformance was substantial, over the 12-year period of the study, the market portfolio generated a return of only 30.5 % or 2.25% pa, dividends included.
How To Improve the Returns of a High Free Cash Flow Yield Investment Strategy
In the above research report, we not only tested single valuation ratios, but we also tested how you can improve returns by combining free cash flow yield with other ratios.
Improve Your Free Cash Flow Yield Returns
The following table shows you the returns you could have achieved if you could combine high 12-month (or TTM) free cash flow yield companies with 14 other ratios and indicators.
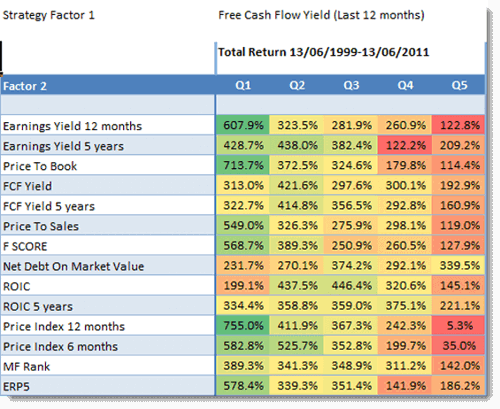
Source: Quantitative Value Investing in Europe: What works for achieving alpha
Look At Column Q1
Look at the returns in column Q1, it shows the returns generated by first selecting the 20% best free cash flow yield companies combined with the ratios in the column called Factor 2.
Best Combination +755% Was Momentum (506.3% Improvement)
As you can see, when combined with Price Index Momentum (12 months), it works even better, delivering greatly improved returns. +755% total return, more than double what Free Cash Flow Yield alone achieved.
Price index 12 months is calculated as the current share price / share price 12 months ago.
This means if you invested only in the 20% of high free cash flow yield companies that also had the top 20% 12 months price increase (price index) you could have increased your return by 506.3% (755.0% - 248.7%) compared to if you only invested in companies with the highest free cash flow yield.
That is an improvement of just over 2 times the original return!
Build Your Own FCF Yield Screen
Every ratio discussed in this article is available in the screener. Set your own FCF yield thresholds, combine with quality filters, and screen across 22,000+ companies worldwide.
Start Screening for High FCF Yield Stocks
No credit card needed. Cancels automatically after 30 days.
Best High Free Cash Flow Yield Investment Ideas for 2026
In this section, we show you actionable investment ideas. You will see two lists of investment ideas:
1. One is a “stand-alone” high free cash flow yield investment idea.
2. The other is free cash flow yield plus 12-month momentum (Price Index 12 months).
In the list, you will see some extreme yields. Those can be outliers. The goal is not to find the highest number. The goal is to find cash-rich companies that are also investable.
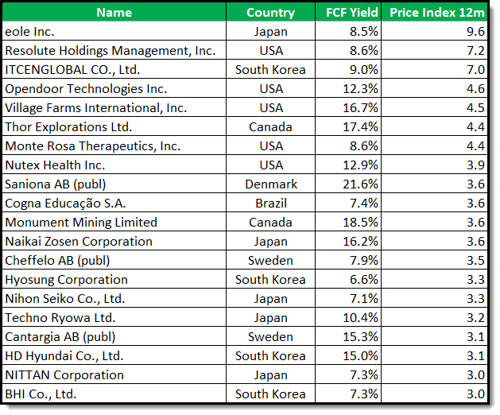
Best High Free Cash Flow Yield Investment Ideas Worldwide For 2026
High Free Cash Flow Yield investment ideas
This is what the screen looked like:
-
All countries worldwide included
-
Top 20% Free Cash Flow Yield companies
-
Minimum daily trading volume of $100,000
-
Minimum company market value of $100 million
-
Financial statements updated in the last 6 months
-
Results sorted by Free Cash Flow Yield from undervalued to expensive
There were some wild numbers (most likely outliers) that ranked best so I went down the list a bit to show you companies with more realistic Free cash flow yields.

Source: Quant Investing Stock Screener
Free Cash Flow Yield combined with Price Index 12 month
This is what the screen looked like:
-
All countries worldwide included
-
Top 20% Free Cash Flow Yield companies
-
Minimum daily trading volume of $100,000
-
Minimum company market value of $100 million
-
Financial statements updated in the last 6 months
-
Results sorted by Price Index 12 months (Momentum) from best to worse
Source: Quant Investing Stock Screener
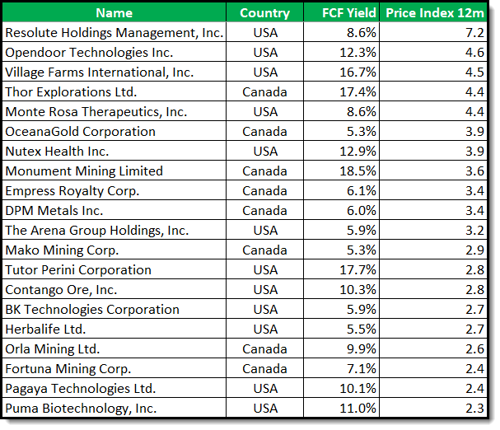
Best High Free Cash Flow Yield Investment Ideas in North America for 2026
High Free Cash Flow Yield investment ideas
This is what the screen looked like:
-
USA and Canada selected
-
Top 20% Free Cash Flow Yield companies
-
Minimum daily trading volume of $100,000
-
Minimum company market value of $100 million
-
Financial statements updated in the last 6 months
-
Results sorted by Free Cash Flow Yield from undervalued to expensive

Source: Quant Investing Stock Screener
Free Cash Flow Yield combined with Price Index 12 month
This is what the screen looked like:
-
USA and Canada selected
-
Top 20% Free Cash Flow Yield companies
-
Minimum daily trading volume of $100,000
-
Minimum company market value of $100 million
-
Financial statements updated in the last 6 months
-
Results sorted by Price Index 12 months (Momentum) from best to worse
Source: Quant Investing Stock Screener
Get live 2026 FCF yield data — run this screen yourself
The ideas above were generated with live data from the Quant Investing screener. With a subscription you run the same screen yourself — top 20% FCF yield, sorted by momentum, filtered by any region — and get current results updated daily.
You also get automatic email alerts when new companies enter your screen, so you never miss a new high FCF yield opportunity as it appears.
Get live 2026 FCF yield data — see pricing
Full 100% money-back guarantee up to 30 days after subscribing. No long-term contract.
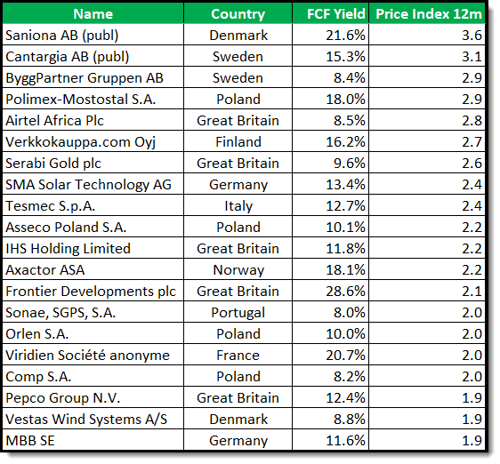
Best High Free Cash Flow Yield Investment Ideas in Europe for 2026
High Free Cash Flow Yield investment ideas
This is what the screen looked like:
-
EU countries, Scandinavia and the UK selected
-
Top 20% Free Cash Flow Yield companies
-
Minimum daily trading volume of $100,000
-
Minimum company market value of $100 million
-
Financial statements updated in the last 6 months
-
Results sorted by Free Cash Flow Yield from undervalued to expensive

Source: Quant Investing Stock Screener
Free Cash Flow Yield combined with Price Index 12 month
This is what the screen looked like:
-
EU countries, Scandinavia and the UK selected
-
Top 20% Free Cash Flow Yield companies
-
Minimum daily trading volume of $100,000
-
Minimum company market value of $100 million
-
Financial statements updated in the last 6 months
-
Results sorted by Price Index 12 months (Momentum) from best to worse
Source: Quant Investing Stock Screener
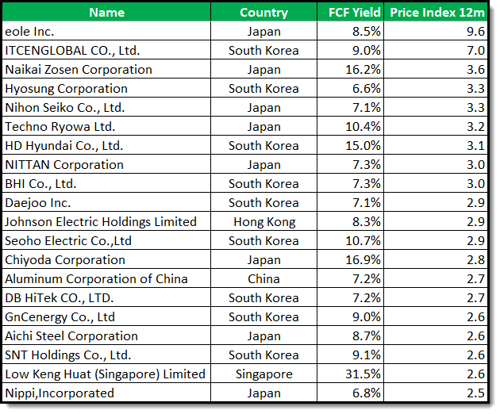
Best High Free Cash Flow Yield Investment Ideas in Asia for 2026
High Free Cash Flow Yield investment ideas
This is what the screen looked like:
-
Australia, China, Hong Kong, Japan, South Korea, New Zealand and Singapore selected
-
Top 20% Free Cash Flow Yield companies
-
Minimum daily trading volume of $100,000
-
Minimum company market value of $100 million
-
Financial statements updated in the last 6 months
-
Results sorted by Free Cash Flow Yield from undervalued to expensive

Source: Quant Investing Stock Screener
Free Cash Flow Yield combined with Price Index 12 month
This is what the screen looked like:
-
Australia, China, Hong Kong, Japan, South Korea, New Zealand and Singapore selected
-
Top 20% Free Cash Flow Yield companies
-
Minimum daily trading volume of $100,000
-
Minimum company market value of $100 million
-
Financial statements updated in the last 6 months
-
Results sorted by Price Index 12 months (Momentum) from best to worse
Source: Quant Investing Stock Screener
Get the Latest 2026 FCF Yield Investment Ideas
The stock tables above are a snapshot. The screener updates weekly with live data across 22,000+ companies, so you can run this exact FCF yield screen any time and see what qualifies today.
See Current FCF Yield Stock Ideas with Live Data
100% money-back guarantee up to 30 days.
Actionable Investment Ideas You Can Use Right Now (Beginners and Advanced)
If you are a beginner or a more advanced investor, either investment strategies or a combination of the two will give you solid investment ideas.
We recommend you always pick a minimum of 30 to 50 stocks, spread across industries. Include even more stocks if you do not want to do any research on each company.
Keep your minimum size and volume rules to the ones we suggested above or larger. This helps you avoid stocks that can trap you because you cannot sell fast.
Also, set clear risk management rules before you buy. For example, you can use a trailing stop loss rule of 15% or 20% and you can stop buying when markets are in a clear downtrend. Systems like this reduce emotion and reduce stress.
Final thoughts. Your edge in 2026
Free cash flow yield is not magic. But it is one of the best ways to focus on what matters. Real cash. If you build your process around it, you stop reacting to noise. You start making calm, repeatable decisions with a good investment strategy.
Your next step is simple. Run the screen. Save it. Then buy a basket of stocks that fit your rules. You can do this all at once, quarterly or a few each month.
You do not need perfect investment ideas; you need a good process that you can stick to.
FREQUENTLY ASKED QUESTIONS
1. What is Free Cash Flow Yield, and why should I care about it?
Free Cash Flow Yield tells you how much real cash a company generates compared to its full value. It is harder to fake than earnings. That makes it a more honest way to find undervalued stocks. If a company has strong free cash flow, it can pay dividends, buy back shares, or grow the business - all good signs for investors.
2. How does Free Cash Flow Yield help avoid risky stocks?
Earnings can be misleading because companies use accounting tricks. But cash is real. Free Cash Flow Yield helps you avoid stocks that look cheap but are not producing real cash. This gives you a safer starting point when choosing what to buy.
3. Has Free Cash Flow Yield been tested over time?
Yes. It has been tested for over 40 years in the US and 12 years in Europe. In both tests, high Free Cash Flow Yield companies gave great returns. In fact, it was the second-best ratio tested. That gives you confidence that the strategy works across time and countries.
4. Can Free Cash Flow Yield work better if combined with other tools?
Yes. If you combine Free Cash Flow Yield with momentum - buying companies whose share price rose over the last 12 months - you can do even better. In Europe, this combo more than doubled the return of using Free Cash Flow Yield alone.
5. How many stocks should I buy using this strategy?
Buy at least 30 to 50 stocks. Spread them across different industries. This helps lower risk and makes sure your results do not depend on just a few companies. More is better if you do not want to research each stock closely.
6. What should I avoid when using Free Cash Flow Yield?
Avoid chasing the highest yield number. Some outliers may look great but are not safe. Stick to solid companies with realistic cash flows. Also, use rules to manage risk - like trailing stop-losses and avoiding stocks in a falling market.
7. How can I start using this strategy right away?
You can run a screen for Free Cash Flow Yield using tools like the Quant Investing screener. It lets you set your own rules and even sends ideas to your inbox. Start small, follow a system, and build your portfolio over time. The goal is not perfection. It is having a clear, repeatable process.
8. What is a good free cash flow yield?
Research shows the top 20% of companies by FCF yield (roughly FCF yields above 8-10% depending on market conditions) consistently outperform. In the 40-year Alpha Architect study, the cheapest 20% of companies by FCF yield returned 16.6% per year versus 7-8% for the market average.
9. Is FCF yield better than P/E ratio?
For most purposes, yes. FCF yield uses enterprise value (which includes debt and cash) rather than just market cap, making it a more complete measure of what you pay. It also uses cash flow rather than earnings, which is harder to manipulate through accounting choices. In 40 years of US data, FCF yield outperformed P/E (earnings-to-price) by approximately 2-3% per year.
10. How do you combine FCF yield with momentum?
First screen for the top 20% of companies by FCF yield. Then sort those companies by 12-month price index (current price divided by price 12 months ago) from highest to lowest. Invest in the top companies by momentum from within that value-filtered list. This combination returned +755% over 12 years in European markets versus +248% for FCF yield alone.
