

In the dynamic world of stock market investing, distinguishing between zombies and quality stocks is crucial. The Financial Strength Score (FS-Score), developed by the innovative team at Alpha Architect, is a great tool that lets you do exactly this - find quality investment ideas.
It builds upon the respected Piotroski F-Score, but with a few modern updates and 10 ratios in stead of the nine used in the F-Score.
As you will see it's a great tool for you to refine your portfolio with quality stocks.
The essence of the FS-Score lies in its 80/20 ability (it uses the important 20% of information to give you the 80% of value) to evaluate the underlying quality of stocks through a detailed analysis of financial health indicators.
The Ratios Behind the FS-Score
The FS-Score covers Current Profitability to Stability and Recent Operational Improvements with the following metrics:
Current Profitability:
ROA (Return on Assets): If positive, scores 1; otherwise, 0.
FCFTA (Free Cash Flow to Total Assets): If positive, scores 1; otherwise, 0.
ACCRUAL: If Free Cash Flow is greater than ROA, scores 1; otherwise, 0.
Stability:
ΔLEVER (Change in Leverage): If leverage ratio decreases, scores 1; otherwise, 0.
ΔLIQUID (Change in Liquidity): If the liquidity ratio improves, scores 1; otherwise, 0.
NEQISS (Net Equity Issuance): If repurchases exceed equity issuance, scores 1; otherwise, 0.
Recent Operational Improvements:
ΔROA (Change in Return on Assets): If ROA increases, scores 1; otherwise, 0.
ΔFCFTA (Change in Free Cash Flow to Total Assets): If FCFTA increases, scores 1; otherwise, 0.
ΔMARGIN (Change in Gross Margin Ratio): If margins improve, scores 1; otherwise, 0.
ΔTURN (Change in Asset Turnover Ratio): If asset turnover improves, scores 1; otherwise, 0.
The FS-Score is then calculated by adding the scores from these ten signals, resulting in a score between 0 and 10.
A high FS-Score signals a company that is not only financially sound but also well-positioned for sustainable growth, making it a crucial tool for your screening toolbox.
Click here to start using the FS-Score in your portfolio NOW!
Does the FS-Score Work?
When developing the score Alpha Architect tested it extensively to make sure it performs better than the Piotroski F-Score.
Back Test 1: General Stock Performance (1974-2014)
The first back test they looked at the performance of all stocks scoring between 6 to 9 on the F-Score against those scoring between 7 to 10 on the FS-Score over the 41-year period from January 1, 1974, to December 31, 2014.
The back test universe was the largest 40% New York Stock Exchange companies to avoid biases associated with smaller stocks.
Over the back test period the FS-Score's compound annual growth rate (CAGR) was 13.3%, surpassing the F-Score's 12.6% and significantly outperforming the S&P 500's 11.2%.
This improvement, albeit modest but remember it is over 41 years, underscores the FS-Score's enhanced ability to identify quality stocks.
To give you an idea this is the growth of $1000 invested in the three strategies:
- FS-Score end value $167,789.
- F-Score end value $130,120.
- S&P 500 end value $77,881
Also, the FS-Score returns had a slightly lower standard deviation and downside deviation compared to the F-Score, indicating improved risk-adjusted returns with a higher Sharpe ratio.
Back Test 2: Value Stocks Performance (1974-2014)
The second back test looked at "cheap" stocks, defined by their placement in the bottom 20% based on book-to-market ratios (20% cheapest Price to Book companies). This was the same valuation ratio used in the Piotroski F-Score’s original study.
Stocks with F-Scores of 6 to 9 were compared to those with FS-Scores of 7 to 10 over the same 41-year period.
This test shows you the FS-Score's strengths with a value investment strategy.
Over the 41-year period the low price to book high FS-Score strategy generated a CAGR of 15.9% versus 15.2% for the low price to book high F-Score strategy. Both strategies beat the S&P 500's 11.2% CAGR.
To give you an idea this is the growth of $1000 invested in the three strategies:
- FS-Score end value $425,599.
- F-Score end value $331,946.
- S&P 500 end value $77,881
This further reinforced the FS-Score's value in identifying high-quality, undervalued stocks!
Key Takeaways
The findings from these back tests shows the FS-Score's effectiveness as a quality indicator for stock selection.
As you saw the FS-Score outperforms both as a general and value stock investment strategies. It consistently delivered higher compound annual growth rates than the F-Score and the S&P 500, confirming its value as a better indicator for identifying quality stocks.
If you are focused on value stocks, you can see the FS-Score is a better tool to help you find quality stocks with higher returns.
How to Integrate the FS-Score into Your Investment Strategy
Incorporating the FS-Score into your investment decision-making process is easy and can significantly impact your portfolio's performance.
- Start by adding the FS-Score to your screens: Do this by adding the FS-Score as a primary screening criteria to your screens. This will make sure you focus your search on quality stocks.
- Prioritize High Scoring Stocks: Add the FS-Score as an output column to your screens so that you can prioritize companies with the highest FS-Scores (7 to 10).
Leveraging the FS-Score for Enhanced Portfolio Quality
The addition of the FS-Score gives you another great analysis tool, to help you focus on quality in your stock screening process. It does this by giving you an in-depth view of a company's financial stability and growth prospects without you having to look at heaps of annual reports and sheets of ratios.
It helps you make smarter, more informed investment decisions.
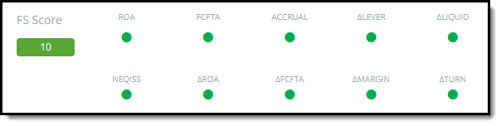
This is what the FS-Score looks like in the company dashboard:
Act Now: Elevate Your Portfolio with the FS-Score
Ready to transform your investment approach and focus more on quality companies?
The FS-Score, developed by the experts at Alpha Architect, is the tool you need to sift through the noise and find those high-quality stocks poised for growth.
Sign up today and start leveraging the power of FS-Score in your portfolio. It's time to make informed, confident investment decisions that pave the way for sustainable returns.
Click here to elevate your investing game with the FS-Score – your gateway to higher-quality investments.
Click here to start using the FS-Score in your portfolio NOW!
