

When it comes to investing, understanding the health or quality of a company is crucial. That's where financial ratios come in handy, and one particularly insightful metric is the Financial Strength Score (FS-Score).
This ratio is an enhanced version of the well-known Piotroski F-Score, and has been developed and tested by the great guys at Alpha Architect as described in the article Value Investing Research: Simple Methods to Improve the Piotroski F-Score.
It's designed to help you find stocks with strong financial health and operational efficiency.
This article tells you how FS-Score calculated, and how you can use it to make smarter investment decisions.
What does the ratio tell you?
The FS-Score is a comprehensive measure of 10 ratios that evaluates a company's financial stability and growth prospects.
It considers various aspects of a company's financial statements to assess its profitability, leverage and liquidity, and operational efficiency.
A high FS-Score indicates a company is financially healthy and could be a promising investment opportunity, while a low score may signal financial distress or poor operational performance.
How the FS-Score is calculated
The FS-Score is the sum of ten different binary signals, each reflecting a specific financial aspect of a company.
They are organised into three main areas:
- Current profitability,
- Stability, and
- Recent operational improvements.
Here's a breakdown of these signals and how they're calculated:
Current Profitability:
ROA (Return on Assets): If positive, scores 1; otherwise, 0.
FCFTA (Free Cash Flow to Total Assets): If positive, scores 1; otherwise, 0.
ACCRUAL: If Free Cash Flow is greater than ROA, scores 1; otherwise, 0.
Stability:
ΔLEVER (Change in Leverage): If leverage ratio decreases, scores 1; otherwise, 0.
ΔLIQUID (Change in Liquidity): If the liquidity ratio improves, scores 1; otherwise, 0.
NEQISS (Net Equity Issuance): If repurchases exceed equity issuance, scores 1; otherwise, 0.
Recent Operational Improvements:
ΔROA (Change in Return on Assets): If ROA increases, scores 1; otherwise, 0.
ΔFCFTA (Change in Free Cash Flow to Total Assets): If FCFTA increases, scores 1; otherwise, 0.
ΔMARGIN (Change in Gross Margin Ratio): If margins improve, scores 1; otherwise, 0.
ΔTURN (Change in Asset Turnover Ratio): If asset turnover improves, scores 1; otherwise, 0.
The FS-Score is then calculated by summing up the scores from these ten signals, resulting in a score between 0 and 10.
How you can use the ratio
Available as a screening ratio: Yes
Sort the column from high to low to identify companies with the highest FS-Scores.
Available as an output column ratio: Yes
To leverage the FS-Score effectively in your screener output, add it as a column under the "Quality" heading in your stock screener.
How to select the highest ratio companies:
To find companies with the highest or best FS-Score, adjust the slider from 0% to 10%. This filters out the top performers based on their FS-Score, making it easier for you to identify potential investment opportunities.
FS Score in the Company Dashboard
You can see the FS-Score as well as the value of all its components in the Company Dashboard under the Quality heading.
This is that it looks like:
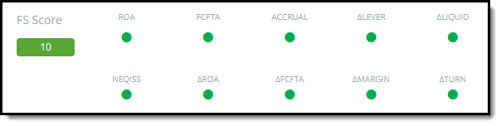
F-S Score in the company dashboard
Reminder:
All ratios are calculated on a trailing 12 months (TTM) basis, ensuring you're working with the most current and relevant financial data.
Ready to make smarter investment decisions?
Click here to start using the FS-Score in your portfolio NOW!
Discover companies that are financially robust and operationally efficient. Don't miss out on the opportunity to enhance your investment strategy with the power of the FS-Score.
Click here to start finding your own high FS-Score companies NOW!