

This article is a website version of our weekly FREE Best Ideas Newsletter sent on 14.02.2023. Sign up here to get it in your inbox every Tuesday.
This week you can see how to cut your company analysis time by using two new features we recently added to the company dashboard.
To do this I'm going to show you the valuation change of two well-known technology companies:
- Apple and
- Meta Platforms Inc. (previously Facebook).
Even if you aren’t a screener subscriber, I am sure you will also find the valuation change interesting so keep reading.
The dashboard cuts you on analysis time
If you haven't tried it already take a look at the company dashboard we added to help you quickly get an idea of:
- What a company does
- How it is valued
- What its share price has done
- How it compared to its peers
I don't want to make this e-mail too long so here is a link where you can see what it is all about.
Improved company dashboard gives you just the info you need
Now includes historical valuation numbers
We recently expanded the dashboard to show you historical valuation numbers.
It is very easy to use simply hold your mouse over the historical icon and the chart will appear – this is what it looks like:
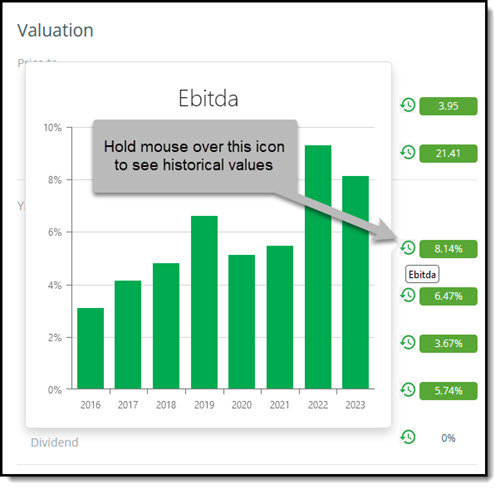
Getting back to Apple and Meta.
How Apple Inc. has developed
This is how the valuation of Apple has changed over the past eight years.
The chart below shows you the current valuation, as well as on this day over the past seven years.
Price to Earnings
This is how Apple was valued over the past eight years on a Price to Earnings (PE) basis.
Even though its PE ratio has dropped from over 35 to just over 25 it is still a lot more expensive than in 2019.
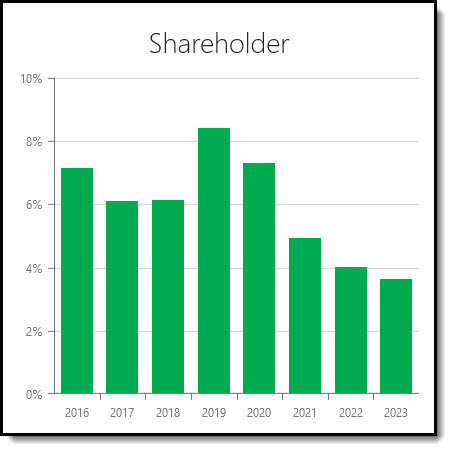
Shareholder Yield
A quick reminder. Shareholder Yield is the sum of Apple’s Dividend yield + Percentage of Shares Repurchased.
As you can see its shareholder yield has not been this low over the past eight years, mainly due to lower stock buybacks. .
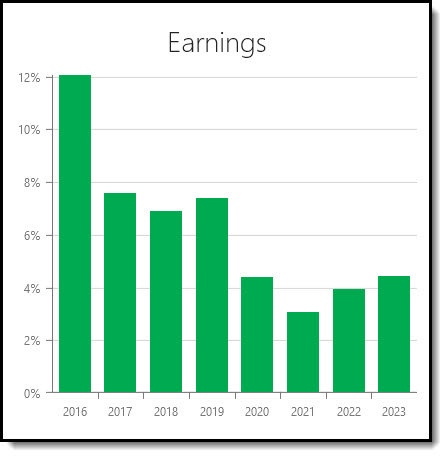
Earnings Yield
Earnings Yield (EBIT to EV) equals Apple’s operating Income or earnings before interest and taxes (EBIT) divided by Enterprise Value.
As you can see also in terms of Earnings Yield Apple is not cheap compared to its past valuation.
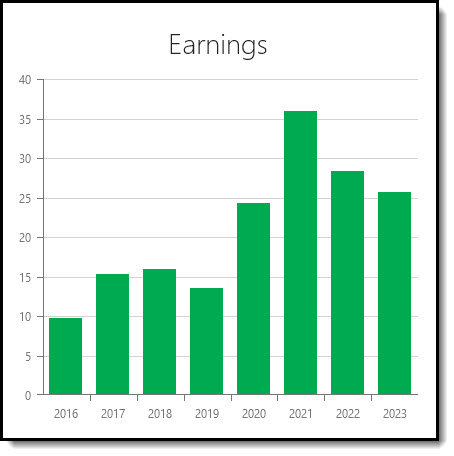
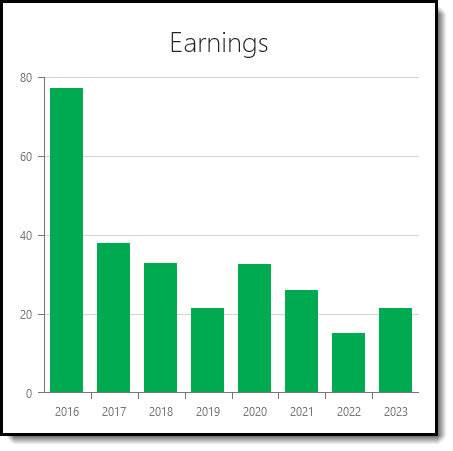
How Meta Platforms Inc. (formerly Facebook) has developed
Now let us look at how the valuation of Meta Platforms has developed.
Price to Earnings
As you can see in 2022 Meta had its lowest valuation by far!
The huge price jumps this year is also clearly visible. I had it on my buy list but never did, now I just watched as it jumped +18% on the announcement of its 2002 results
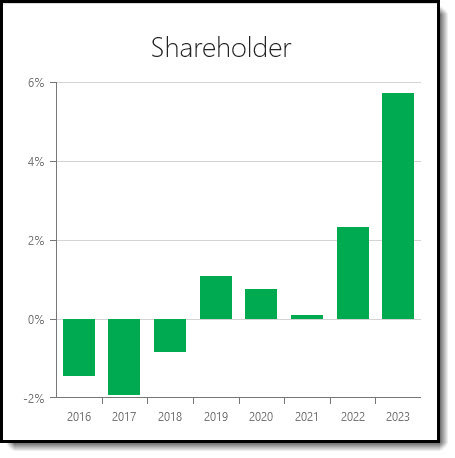
Shareholder Yield
Based on Shareholder Yield Meta looks quite interesting, even for a value guy like me!
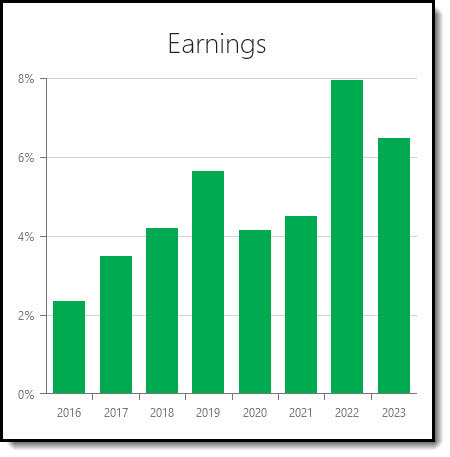
Earnings Yield
Based on Earnings Yield (EBIT/EV) also getting interesting but it’s not even close to the companies recommended in the newsletter.
I hope you find the new screener feature helpful, or of you are not a subscriber how the valuation of Apple and Meta has changed over the past eight years.
Your, helping you get the highest return analyst
PS To start finding great companies that exactly meet your investment strategy right now click here.
PPS It is so easy to forget, why not sign up now before you get distracted?
