

Estimated Reading Time: 8 minutes
In this article you will learn seven key financial ratios to help you find companies that are likely to perform poorly, making them ideal candidates for short selling. This guide walks you through how to use each ratio step by step, ensuring you can spot financial manipulation, potential bankruptcy, or weak cash flow.
By understanding these indicators, you’ll be better equipped to make informed short-selling decisions, potentially boosting your returns. This article is essential if you want to avoid risky investments and enhance your portfolio strategy.
Do you sell stocks short? If you do this article shows you the best ratios and indicators you can use to find the best companies to short.
I also show you exactly how to use them with step by step instructions.
Find companies with manipulated financial statements
The Beneish M-Score
Messod Beneish, an accounting professor at Indiana University's Kelley School of Business, outlined a quantitative approach to detecting financial statement manipulation in his 1999 paper “The Detection of Earnings Manipulation.”
He based his model on forensic accounting principles, calling it the “probability of manipulation”, “PROBM” model or the Beneish M-Score.
Prof Beneish collected a sample of known earnings manipulating companies. Then he identified their main characteristics and used those characteristics to create a model for detecting manipulation.
Does it detect manipulators?
In back tests the M-Score identified approximately half of the companies involved in earnings manipulation before they were discovered.
The M-Score also correctly identified, ahead of time, 12 of the 17 highest-profile fraud cases in the period 1998 to 2002.
The M-Score can help your returns
In a back test the Beneish M-Score consistently improved stock returns from 1993 to 2007.
During this 15-year period stocks that were identified as potential earnings manipulators returned 9.7% less than stocks that were not identified.
Larger than -2.22 is bad
A M-Score score greater than -2.22 indicates a strong likelihood of a company being a manipulator.
Where to find it in the screener?
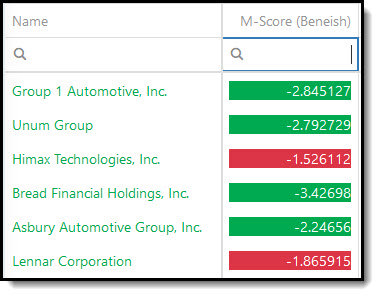
You can easily use the Beneish M-Score when looking for ideas in the screener.
Simply select M-Score (Beneish) as one of the output columns of your screen. You can then use the filter function (click the small funnel icon) to screen out companies with a bad Beneish M-Score.
Find companies that may go bankrupt
Altman Z-score
The Altman Z-Score formula for predicting bankruptcy was published in 1968 by Edward I. Altman, who was, at the time, an Assistant Professor of Finance at New York University.
The formula can be used to predict the probability that a firm will go into bankruptcy within the next two years.
The Z-score uses a few income statement and balance sheet ratios to measure the financial health of a company. You can find more information on how the Altman Z-Score is calculated in the Glossary under the heading Z-Score.
How to interpret the Z-Score
The Z-Score values should be interpreted as follows:
- Z-score of greater than 2.99 = Safe
- Z-score between 1.8 and 2.99 = Middle or grey
- Z-score smaller than 1.80 = Distress
The Altman Z-Score in the screener
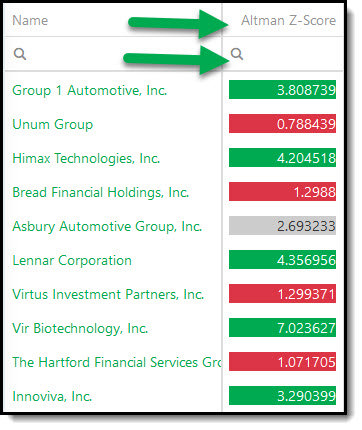
You can easily use the Altman Z-Score in any of your favourite screens.
Simply select Altman Z-Score as one of the output columns of your screen. You can then use the filter function (click the funnel icon) to screen out companies with a bad Z-Score of less than 1.80.
In the screenshot below you can see that the Z-Score values are colour coded so you can easily see what is good (green), middle is (black) and distress (Red).
Can a company repay its debt?
Free cash flow to debt ratio
The free cash flow (FCF) to long-term debt ratio indicates how long it will take a company to pay back its debt, given its current level of FCF generation.
The ratio thus gives you an indication of the financial health of the company.
Good ratio to generate out-performance
A back test in the book Quantitative Strategies for Achieving Alpha showed that the 20% of companies with a high value of FCF to debt (companies that could easily pay back their debt) would have given you substantially better returns than the market and, as you can imagine, substantially better returns than companies with a low FCF to debt ratio.
To find companies to sell short you must look for companies with a weak FCF to debt ratio.
FCF to debt in the screener
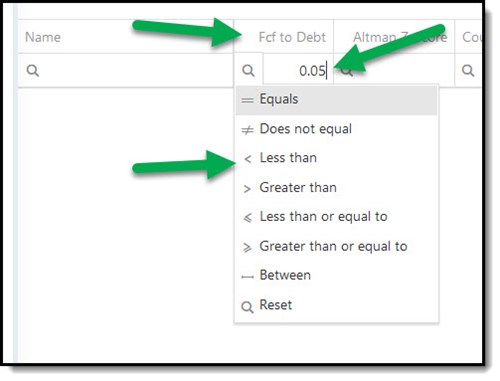
You can use FCF to debt ration as one of the four filters in the screener. Under the heading Quality select Fcf to debt as shown below.
You can also use the column filter function to select only companies with a bad FCF to Debt ratio as shown below.
Are they cooking the books? – the C-Score
In June 2008 James Montier published a very interesting paper called Cooking the books, or, more sailing under the black flag.
In the article he wrote about the C-Score he developed to find companies that were cooking the books and how you can use the C-Score to find companies to short.
He developed the C-Score to determine how many of six common earnings manipulating ratios a company is engaging in.
How is the C-Score calculated?
This is how the C-Score is calculated.
It has six inputs, each designed to identify a part of common earnings manipulation:
- An increasing difference between net income and cash flow from operations. In general, managements have less flexibility in shaping cash flows than earnings. Earnings contain a large number of highly subjective estimates such as bad debts and pension returns. A growing difference between net income and cash flows may also indicate more aggressive capitalisation of costs.
- Increasing days sales outstanding (DSO). This, of course, signifies that accounts receivable are growing faster than sales. This measure is really aimed at picking up channel stuffing (sending inventory to customers).
- Growing day’s sales of inventory (DSI). Growing inventory is likely to indicate slowing sales, never a good sign.
- Increasing other current assets to sales. Clever CFOs know that investors often look at DSO and/or DSI, thus they may use this catch-all line item to help hide things they don’t want investors to look at.
- Falling depreciation relative to gross property plant and equipment. To beat the quarterly earnings target, firms can easily alter the estimate of useful asset life.
- High total asset growth. Some firms become serial acquirers and use acquisitions to distort their earnings. High asset growth firms receive a flag in the score.
These six inputs are then simply added together. For example if a company has increasing DSI it receives a score of one.
High is bad (6 = Bad and 0 = Good)
These are then summed across the six inputs to give a final C-Score from 0 (no evidence of earnings manipulation) to 6 (high likelihood of earnings manipulation).
C-Score back tested results
James back tested the C-Score to determine if it really does have the ability to separate stocks which are likely to underperform.
He tested the C-Score over the 14 year period from 1993 to 2007 on the US and European markets with portfolios formed in June and held for one year.
US – Bad C-Score 8% worse than the market
In the US, stocks with high C-scores underperformed the market by around 8% per year generating a return of only 1.8% p.a. compared to the 10% p.a. the market returned over the same period.
Europe – Bad C-Score 5% worse than the market
In Europe, high C-score stocks underperform the market by around 5% per year compared to the 13% p.a. the market returned over the same period.
Don't use the C-Score alone
In the article James mentioned that the C-Score may be even more valuable if you combine it with a valuation ratio (to identify overvalued companies) as they are more likely to want to cook their books to maintain their “growth” status.
C-Score and price to sales
In a further back test James found that if you combine the C-Score with a price to sales ratio of more than 2 the value added by the C-Score increases substantially.
US – Bad C-Score 14% worse than the market
In the US this combination resulted in a negative return of 4% per year (with the median bad C-Score company losing 6% p.a. and 54% of stocks seeing negative returns).
Europe – Bad C-Score 17% worse than the market
In Europe, the combination of a high C-score and price to sales greater than 2 also generates a negative return of 4% per year (median bad C-Score company lost 10% p.a. and 57% of stocks had negative returns).
Where to find the C-Score in the stock screener
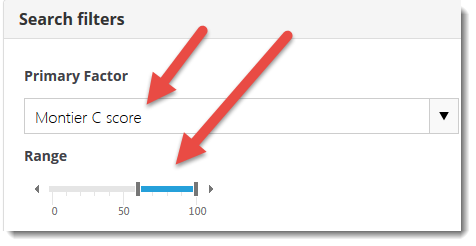
In the screener you can easily find companies with a high Montier C-Score (high chance of book cooking).
You simply use one of the four sliders in the screener under the heading Quality select Montier C Score
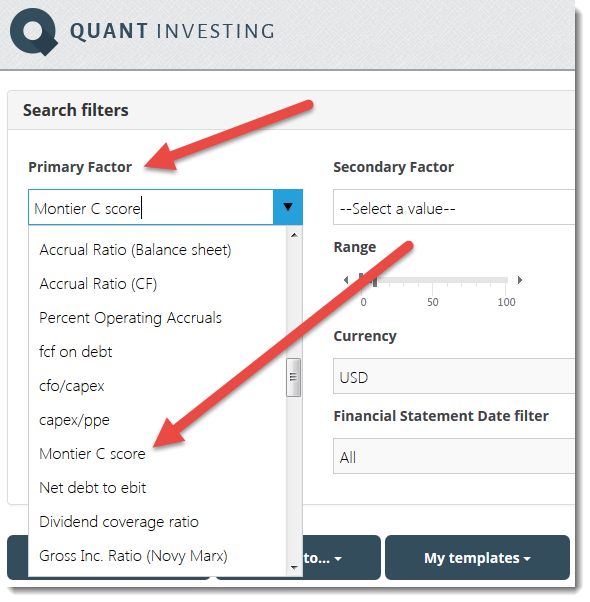
To select only high C-Score companies (book cooking companies) move the slider so to select companies from 60% to 100% as shown below.
Use the Piotroski F-Score to find low quality companies
We have done a lot of testing of the Piotroski F-Score, mainly to find quality companies you can buy. But you can of course also use the F-Score to look for bad quality companies.
Does it work?
In the research paper Quantitative Value Investing in Europe: What Works for Achieving Alpha we tested the Piotroski F-Score on companies in the Eurozone over the 12-year period from 13 June 1999 to 13 June 2011.
In spite of the test period being quite short it was most certainly not a good time to be investor as it included the internet stock market bubble (1999), two recessions (2001, 2008-2009) and two bear markets (2001-2003, 2007-2009).
The F-Score simply works
In spite of the Piotroski F-Score being a quality indicator (it can’t tell you if a company is over or undervalued) if you used it as a single factor to select companies to sell short you would have done surprisingly well.
The following table shows you what your returns you could have earned if you used only the Piotroski F-Score to select investment ideas.
Column Q1 includes companies with a healthy F-Score and Q5 companies with a bad F-Score (low quality companies).
Bad quality companies performed terribly!
Take a look at the column Q5 in the table below. It shows the performance of companies with a Piotroski F-Score of 0 and 1, and as you can see small and mid sized companies performed terribly.
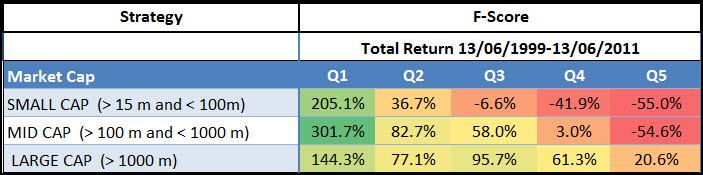
Market returned only 30.5%
For all company sizes the companies with a low F-Score performed a lot worse than the market (large companies less so) which over the 12-year period returned 30.54 % or 2.25% per year, dividends included.
Adding a valuation ratio works even better
We did not test it but I am very sure if you use the Piotroski F-Score along with a valuation ratio like price to sales, (to include expensive companies that make losses), you will be able to identify even better companies to sell short.
Just the start of your process
As I always remind you these using these ratios should only be the first step to find out if a company is a good one to sell short.
But you already know this.
Glossary tells you everything
If you would like to see exactly how all the ratios or indicators are calculated simply go to the stock screener glossary page.
Frequently Asked Questions
1. How can I tell if a stock has high short interest?
Look at the Short Interest percentage change which shows the proportion of shares sold short. Higher percentages can indicate that many believe the stock will drop.
2. What does the Beneish M-Score tell me?
The M-Score helps you spot companies manipulating earnings. If it's higher than -2.22, the company might be cooking the books.
3. How can the Altman Z-Score help me?
It predicts bankruptcy risk. A score below 1.80 suggests financial distress, which is a red flag for long positions but an opportunity for short-selling.
4. Why should I check Free Cash Flow to Debt Ratio?
This ratio shows if a company can pay off its debt. A weak ratio indicates potential trouble, making it a candidate for short-selling.
5. What is the C-Score, and why does it matter?
The C-Score measures the likelihood of earnings manipulation. A higher score indicates a higher risk of accounting tricks.
6. How does the Piotroski F-Score help in short-selling?
It assesses the quality of a company. A low score means poor financial health, which could signal a good short opportunity.
7. Why should I be cautious if a stock has a high Short Interest Change?
A rising short interest could mean that more investors are betting against the stock, which could signal underlying problems.
8. Can the Altman Z-Score alone determine a short-selling opportunity?
While useful, it’s best to combine it with other indicators like the Beneish M-Score for a fuller picture.
9. How do I find companies with a bad FCF to Debt ratio?
Use a screener to filter companies with low FCF to Debt ratios, signalling they might struggle to repay debt, a potential short-sell target.
10. Should I use the C-Score in combination with other metrics?
Yes, combining it with valuation ratios like Price-to-Sales can help identify companies likely manipulating earnings to maintain a facade of growth.
PS To immediately get all these ratios and indicators working in your portfolio click here: Screener sign-up
PPS Why not sign up right now while it's still fresh in your mind?
