

All our back testing have made us big supporters of combining valuation ratios to find undervalued companies. It works well because it lets you find companies that are undervalued from different points of view, for example based on earnings, book value and cash flow.
The first such indicator I wrote to you about was Value Composite One (included in the stock screener) developed by James O'Shaughnessy.
But it has a problem
The problem with the Value Composite One indicator is that it includes the Price to Book ratio.
We have nothing against using the price to book ratio to find cheap companies (it works best after a market crash), but it also under-performs the market for long periods of times.
You can read more about problems with the price to book ratio here: Be careful of this time tested value ratio.
To solve the problem
To solve this problem we develop our own composite valuation indicator called Qi Value.
Not only does it exclude the Price to Book ratio, it also includes ALL the best valuation ratios we have tested, including the work from the research paper Quantitative Value Investing in Europe: What Works for Achieving Alpha.
Qi Value ranks the whole universe of companies (around 22,000) in the Quant Investing stock screener using four valuation ratios. This helps you find the most undervalued companies from different points of view.
How is Qi Value it calculated?
Qi Value is calculated using the following ratios:
EBITDA Yield
Which is calculated as: Earnings before interest, taxes, depreciation and amortisation (EBITDA) / Enterprise Value
Earnings Yield
Calculated as: Operating Income or earnings before interest and taxes (EBIT) / Enterprise Value
(Read more about earnings yield here: A simple ratio beats the world’s best value funds)
FCF Yield
FCF (Free cash flow) Yield is calculated as Free Cash Flow / Enterprise Value.
And free cash flow is equal to cash from operations - Capital expenditure
(You can red more about FCF Yield here: Why and how to implement a high free cash flow yield investment strategy)
Liquidity (Q.i.)
Liquidity (Q.i) is calculated as Adjusted Profits / Yearly trading value.
It thus gives you an indication of how high a company’s yearly traded value per share is compared to its profits. A high value thus means low traded value compared to profits and thus a larger chance of the company’s shares being miss-priced.
A low value means high traded value to profits which means more analysts may follow the company giving you a smaller chance that the company is miss-priced.
It lets you find companies with large controlling shareholders or a stable base of shareholders where traded value is low and thus less analyst interest because they cannot make money recommending and trading of the company’s shares.
(Read more about Liquidity Q.i. here: Liquidity (Q.i.) indicator identifies neglected (miss-priced) companies)
The exact definition of all the ratios can be found in the Glossary.
To start using Qi Value in your portfolio now - Click here
Does it work? Yes, 478% vs index 23%
This all sounds very interesting, but does it work?
We wanted to know and tested the Qi Value indicator thoroughly to make sure it works before telling you about it.
We tested it worldwide (22,000 companies in all the developed markets), against six other valuation ratios as well as the market index over the 14 year period from April 2001 to February 2015.
The following table summarises the results
14 year back test summarised
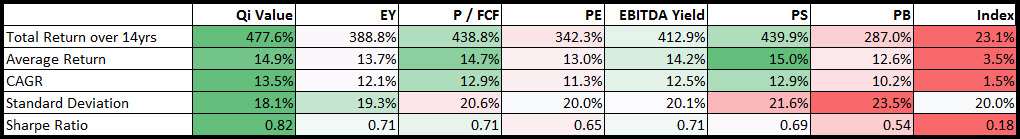
Click table to enlarge
Source: www.quant-investing.com
CAGR (Compound Annual Growth Rate)
We tested the Qi Value indicator against the following ratios:
- Earnings Yield (EY)
- Price to Free Cash Flow (P/FCF)
- Price to Earnings (PE)
- Earnings before interest, taxes, depreciation and amortisation Yield (EBITDA Yield)
- Price to Sales (PS)
- Price to Book (BP)
Qi Value is a lot better
As you can see Qi Value performed better than all the other ratios, except that the average return of the Price to Sales ratio was higher.
Apart from that the Qi Value had:
- The highest compound annual growth rate over the 14 year period
- The lowest standard deviation which means Qi Value returns were not as volatile as the other ratios
- The highest Sharpe ratio (higher is better) which means the Qi Value indicator gave you higher risk adjusted returns. Here is the Sharpe ratio definition.
We updated the back test here +1223%
We updated the Qi Value investment strategy back test to over 22 years from May 2001 to December 2022 across markets worldwide and it returned an astounding 1223%!
You can read the full article here: This investment strategy is working even better than we expected +1223%
To start using Qi Value in your portfolio now - Click here
How to start using Qi Value in your portfolio right now
Where can you find it?
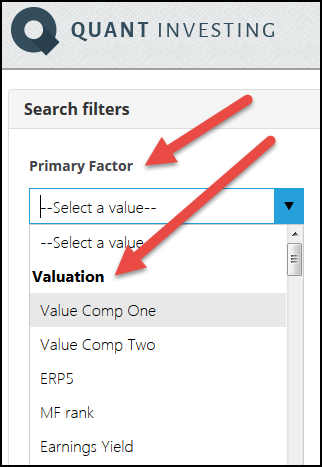
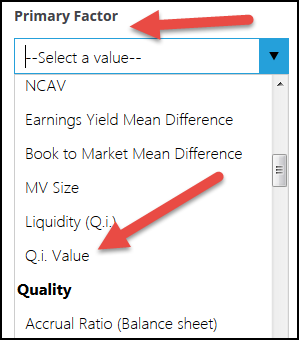
Q.i. Value indicator, like all ratios and indicators in the screener, is very easy to find and use. You can select it in any one of the four funnels (or filters) as shown below.
Qi Value is one of the last items under heading Valuation.
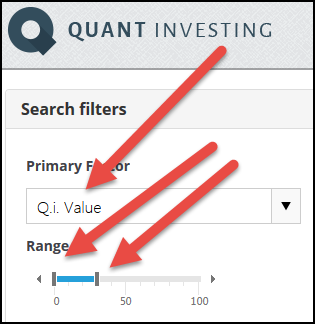
Get the most undervalued companies
To find the most undervalued companies set the slider from 0% to as far as you would like to go. The top 30% most undervalued companies are selected in the image below.
Combine Qi Value with your investment strategy
Once you have selected undervalued companies with Qi Value you can of course add your favourite ratios or indicators, for example:
Market leaders (large companies on steroids)
The best valuation ratio you can use
From all the research we have done the Qi Value indicator is without a doubt the best valuation ratio you can use because it finds undervalued companies based on different valuation ratios.
And as you saw its results speak for themselves, higher returns with lower volatility, something I am sure you find attractive.
PS To start using the Qi Value investment strategy in your portfolio click here
PPS It is so easy to put things off, why not start right now while it is still fresh in your mind
