

If you found this article you have most likely heard of the Value Composite Two investment strategy developed by James O’Shaughnessy and mentioned in his excellent book What works on Wall Street.
This article shows you why Value Composite Two is a great investment strategy and exactly how (step by step) to implement it in your portfolio.
First a bit of background information…
I am sure you have also seen too many back tested investment strategies that showed that low price to book or low price to earnings ratio stocks outperformed the market over long periods of time.
Multiple ratios give you better returns 80% of the time
But do you know that if you look for undervalued companies based on a number of different valuation ratios you get higher returns compared to if you use only one ratio? James O’Shaughnessy tested and proved this in What works on Wall Street.
He found that companies selected based on a number of valuation measurements outperformed companies undervalued on any single valuation ratio 82% of the time.
If you think about it this makes a lot of sense.
If you only use the price to book ratio to find ideas you may find a lot of great investments after a big market correction but a lot of bad quality businesses when the markets are not cheap.
Also if you only use the price to book ratio you will completely miss companies that are cheap based on free cash flow, price to earnings or earnings yield (EBIT/EV).
The answer - a combination of ratios
The answer to this problem is to use a combination of valuation ratios that let you find undervalued companies from different valuation angles. For example book value, cash flow, net profit and operating profit.
Already done for you
Luckily James already developed and tested a combination of valuation ratios for us and tested it to make sure it gives you market beating returns.
He tested this valuation ranking for all 10-year rolling periods over the 45 year period between 1964 and 2009 and as I said found that it outperformed companies undervalued on any single valuation ratio 82% of the time.
It’s called Value Composite Two
James called his collection of valuation ratios Value Composite Two (VC2) and it is calculated using the following five valuation ratios:
- Price to book value
- Price to sales
- Earnings before interest, taxes, depreciation and amortization (EBITDA) to Enterprise value (EV)
- Price to cash flow
- Price to earnings
- Shareholder Yield (Dividend yield + Percentage of Shares Repurchased)
In the Quant Investing stock screener the Value Composite Two has a value between 0 (undervalued company) and 100 (expensive or overvalued company).
Click here to start using Value Composite Two in your portfolio NOW!
How is the Value Composite Two ranking calculated?
Just how is the Value Composite Two ranking of a company calculated you may be thinking?
It is really quite easy.
You rank each company against all other companies based on every one of the six valuation ratios and then calculate a combined ranking for the company.
In the Quant Investing stock screener to make it easier to understand we give each company a percentile ranking (1 to 100) for each of the six valuation ratios.
To get the combined rank these six values are added together and the Value Composite Two ranking of the companies are then grouped by percentile ranking with the 1% best ranked companies getting a value of 1 the next 1% of companies a value of 2 and so on.
For example if a company has a price to sales ratio that is in the lowest one percent for all the companies in the database, it gets a price to sales rank of 1 (lower is more undervalued) and if a company has a PE ratio in the highest one percent (it is overvalued) of all the companies in the database it will get a PE rank of 100.
If a ratio is missing?
If a value is missing, because a company made losses and no price earnings ratio is available we give it a neutral value of 50 for that ratio.
Once all the companies have been ranked on all valuation ratios you add up all the values (of the 6 valuation ratios) for each company and rank all the companies in percentiles (from 1 to 100) on this one combined ranking.
Undervalued = 1 and overvalued = 100
In the screener this means companies that are the most undervalued have a Value Composite Two (VC2) rank of 1 those with the worst score (most expensive or overvalued company) get a rank of 100.
Does it give you higher returns?
What did James find when he tested Value Composite Two?
In the blog post The Value of Value Factors James showed the results of a 46 year back test from 1963 to 2009 where he compared the returns composite ratios to single valuation ratios.
It worked very well as you can see from the following two charts:
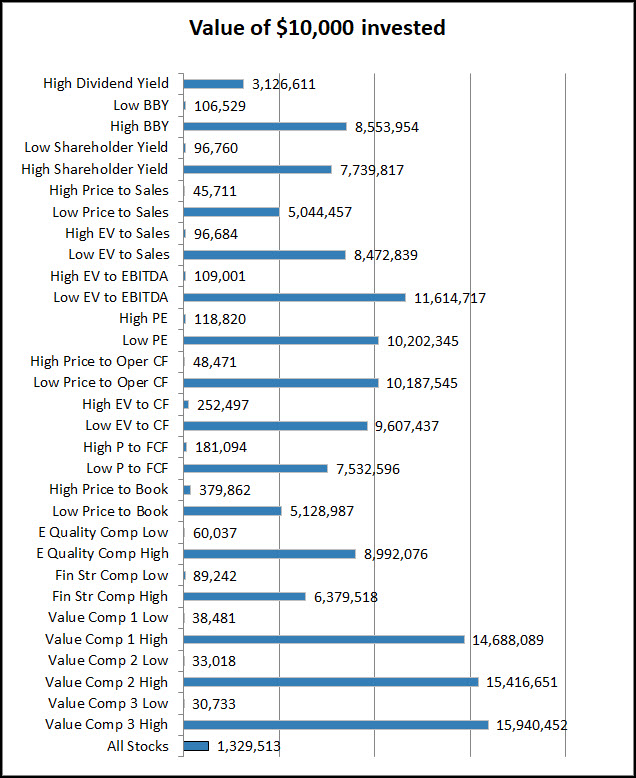
Source: The Value of Value Factors
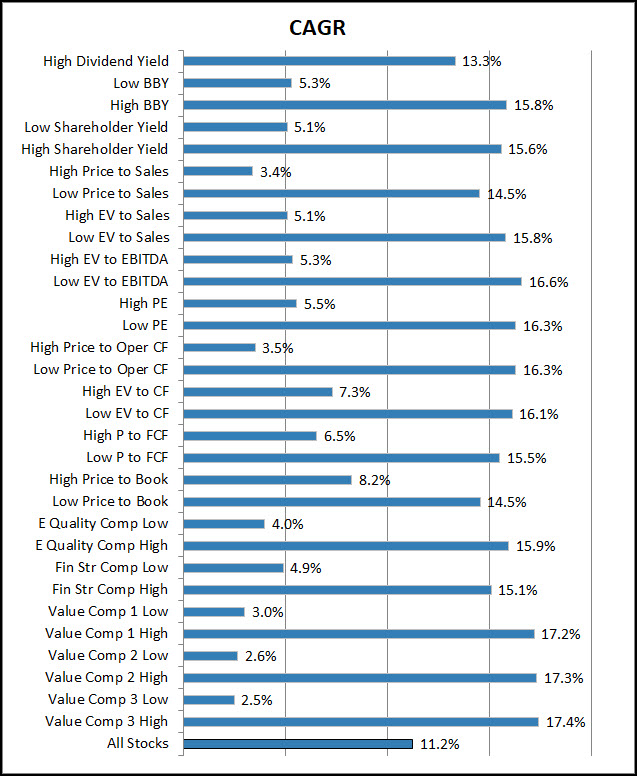
Source: The Value of Value Factors
In the charts you can see the returns if you invested in cheap and expensive companies based on a number of single valuation ratios and then as well as the three composite valuation ratios James developed: Value Composite 1, 2 and 3 which all performed very well.
Click here to start using Value Composite Two in your portfolio NOW!
Investing in expensive companies is a bad idea
What you can also very clearly see is that investing in expensive companies, irrespective of what ratio you use, it is a bad idea, a VERY bad idea.
Our 12 year back test...
We have not back tested the Value Composite Two indicator as we already had very good results testing Value Composite One and am convinced that it works.
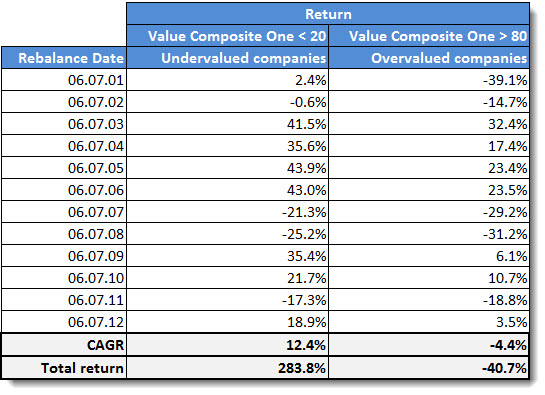
We tested the Value Composite One (VC1) over the 12 years between June 2001 and June 2012.
Total return of 283%, market only 73%
If over this period you bought non-financial companies (in Europe EU, the UK, Switzerland and Scandinavia) with the VC1 value of less than 20 (the 20% most undervalued companies) you would have earned a respectable 12.4% per year or 283% in total.
This compares very well to the 4.9% per year or 73% of all the companies (effectively the market) we tested.
If you only bough expensive companies?
We also tested what would have happened if you only bought companies with a VC1 value of more than 80, in other words the 20% most expensive companies.
Over the same 12 year period from June 2001 to June 2012 you would have lost 4.4% per year for a total loss of 40.7% over 12 years.
Results summarised
CAGR = Compound annual growth rate (Index return = 4.9% per year and 73% over the 12 year period)
If you want an even higher return
We did not test (it's a future project) is what returns you could have earned if you combined the Value Composite Two score with another factor like the top 20% of companies in terms of 6 month Price Index or the Piotroski F-score for example.
It is very likely that your returns will be substantially higher as you saw with the two factor strategies we tested in the research paper Quantitative Value Investing in Europe: What works for achieving alpha.
Where to find it in the stock screener
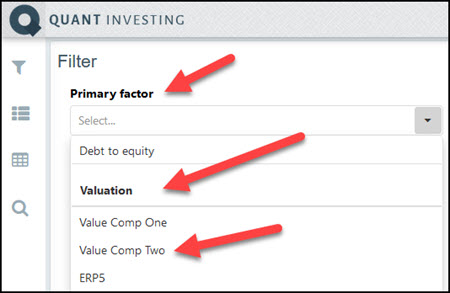
You can easily find undervalued companies using the Value Composite Two indicator with the screener.
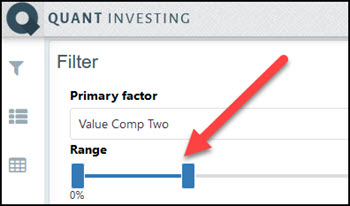
Simply use it as a primary screening factor as shown below:
Slider makes it easy
The slider allows you to easily select the range of Value Composite Two value companies you want, cheapest 30% in the screenshot below.
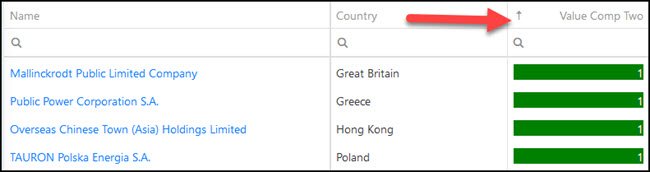
Sort by Value Composite Two
You can also sort any screen you run by the Value Composite Two ranking as shown below:
It’s as simple as that
That is all there is to it.
It is as simple as this to get the Value Composite Two investment strategy working in your portfolio.
Frequently Asked Questions About Implementing the Value Composite Two Investment Strategy
What is the Value Composite Two (VC2) investment strategy?
The Value Composite Two strategy, developed by James O’Shaughnessy, combines multiple valuation ratios to identify undervalued companies. This method uses six ratios: price to book value, price to sales, EBITDA to enterprise value, price to cash flow, price to earnings, and shareholder yield. This composite approach aims to outperform single-ratio strategies by providing a more comprehensive assessment of a company's value.
Why should I use the Value Composite Two strategy instead of a single valuation ratio?
Using a single valuation ratio, like price to book or price to earnings, can lead to misleading results, especially in different market conditions. By combining multiple ratios, the Value Composite Two strategy reduces the risk of selecting overvalued or poor-quality companies and has been shown to outperform single-ratio strategies 82% of the time over a 45-year period.
How is the Value Composite Two ranking calculated?
The Value Composite Two ranking is calculated by assigning a percentile rank (1 to 100) to each company for each of the six valuation ratios. These rankings are then combined into a single score. The companies are then grouped into percentiles, with the most undervalued companies receiving a ranking of 1 and the most overvalued receiving a ranking of 100.
How do I find undervalued companies using the Value Composite Two strategy in the Quant Investing screener?
To find undervalued companies, use the Value Composite Two indicator as a primary screening factor in the Quant Investing screener. Set the slider to select the range of Value Composite Two values you want (e.g., the cheapest 30%). This will filter out companies that are highly ranked according to the combined valuation metrics.
What were the historical returns for the Value Composite strategies?
According to James O’Shaughnessy’s research, the Value Composite Two strategy provided superior returns compared to single-ratio strategies over a 46-year back test. Additionally, a 12-year back test from 2001 to 2012 showed that investing in the 20% most undervalued companies in Europe using the Value Composite One (VC1) returned 283%, compared to the market’s 73%.
Can the Value Composite Two strategy be combined with other factors to improve returns?
Yes, combining the Value Composite Two strategy with other factors like the 6-month Price Index or the Piotroski F-score can potentially enhance returns. While specific combinations with VC2 were not tested, similar two-factor strategies in other research have shown significantly higher returns, suggesting this approach is promising for further increasing investment performance.
PS Everything you need to implement this investment strategy in your portfolio can be found here.
PPS Why not sign up right now while it is still fresh in your mind. You can cancel at any time for a FULL refund if you are not happy. Sign up here.
Click here to start using Value Composite Two in your portfolio NOW!
