

This article shows you the summarised results of all the back tests of a free cash flow yield investment strategy I could find.
Keep reading to the bottom where I show you exactly how to find high Free Cash Flow Yield investment ideas for your portfolio.
Free cash flow yield is a great investment strategy
Using a high free cash flow yield investment strategy makes a lot of sense because it is a “clean” valuation ratio you can use to find undervalued companies.
We call cash flow “clean” value because cash in the company’s bank accounts at the beginning of the financial year plus or minus the cash the business made or loss must be equal to the cash in the bank accounts at the end of the year.
There is not much management can do to manipulate these numbers, except through outright fraud – this means it is a great way to value a company.
What is free cash flow and free cash flow yield
Before we go any further let’s make sure we know what we are talking about.
We define Free Cash Flow (FCF) as: Total Cash from operations (from the company’s Cash Flow Statement) minus Capital Expenditure.
And we define Free Cash Flow Yield as: Free Cash Flow (as calculated above) divided by Enterprise Value.
Click here to start using Free Cash Flow Yield in your portfolio Now!
Does free cash flow yield investing work in the USA?
First let’s find out if free cash flow yield works in the USA.
Luckily the great guys Wes Gray and Jack Vogel at Alpha Architect tested not just free cash flow yield but also normalized (average) valuation ratios in a paper called Analysing Valuation Measures: A Performance Horse-Race over the past 40 Years.
5 strategies tested over 40 years
They tested 5 ratios over the 40 year period from 1 July 1971 to 31 December 2010 to find the best valuation ratio.
They also tested normalized (average) ratios to see if they increase returns.
What ratios did they test?
- Earnings to Market Value (E/M) – You can also call the ratio Earnings to Price – the inverse of the Price to Earnings ratio
- Earnings before interest and taxes and depreciation and amortization to total enterprise value (EBITDA/TEV)
- Free cash flow to total enterprise value (FCF/TEV) – FCF was defined as Net Income + Depreciation and Amortization - Working Capital Change - Capital Expenditures
- Gross profits to total enterprise value (GP/TEV)
- Book to market (B/M) – the inverse of Price to Book
Companies included and how they tested
- This back test excluded financial companies and utilities, and the smallest 10% of market value companies listed on the NYSE.
- Portfolios were put together on 30 June each year when all the companies were sorted into five quintiles – 20% groups of companies.
- They only included companies for which 8 years of data was available.
- Portfolios were re-balanced on a yearly basis.
How the ratios were calculated
For the one year (1yr) ratios companies were selected based on current numerator (top value) and current denominator (bottom value) for each measure.
For all the normalized ratios (2 years – 8 years) they used the average of the numerator (top value) over the past 2 to 8 years, and divided this average by the current denominator.
For example, the 8 year FCF/EV ratio was calculated using the average of the past 8 years FCF for each company (including the current year), and dividing this by the company’s current total enterprise value (EV).
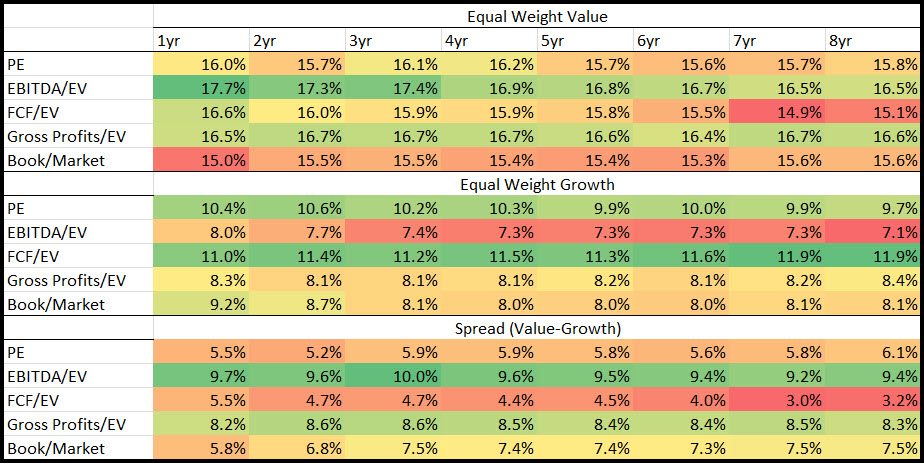
This is what they found:
Click image to enlarge
Source: Analyzing Valuation Measures: A Performance Horse-Race over the past 40 Years.
The Equal Weight Value part of the table shows the equal-weighted returns of the most undervalued (cheap) 20% of companies based on each valuation ration.
The Equal Weight Growth part of the table shows the equal-weighted returns of the most overvalued (expensive) 20% of companies based on each valuation ration.
The Spread (Value-Growth) part of the table shows the difference between the Equal Weight Value and Equal Weight Growth returns of the two above tables.
What they found
As you can see (look at the dark green areas of the table) they did not find that using normalized ratios can add to your returns. Only normalized book to market (inverse of price to book) would have given you slightly higher returns compared to the one year ratio.
The best valuation ratio they found was trailing 12 month EBITDA to EV with an average return of 17.7% over the 40 year test period.
EBITDA to EV was also the ratio the highest spread (Value – Growth) returns which is a further indicator that it is the best ratio to use.
What about free cash flow yield?
As you can see free cash flow yield was the second best ratio they tested, at 16.6% it was 1.1% per year lower than EBITDA/EV.
Still a very respectable return!
Click here to start using Free Cash Flow Yield in your portfolio Now!
Does free cash flow yield investing work in the Europe?
In our book Quantitative Value Investing in Europe: What Works for Achieving Alpha we tested 168 investment strategies in Europe over the 12 year period from June 1999 to June 2011 we also tested 12 months Free Cash Flow yield and 5 year average free cash flow yield.
Free cash flow yield vs Normalized free cash flow yield
In the back test free cash flow yield was defined cash flow from operations minus capital expenditure, divided by enterprise value.
We also tested two versions of free cash flow yield:
- Free Cash Flow Yield Trailing 12 months
- Free Cash Flow Yield – 5 year average (Normalized) defined as the average free cash flow over the past 5 years divided by the current enterprise value.
This is what we found:
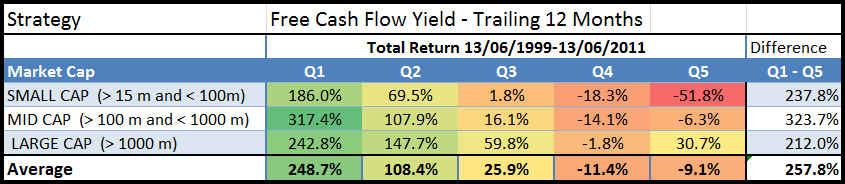
Click image to enlarge
Free Cash Flow Yield Trailing 12 months returns (Source: Quantitative Value Investing in Europe: What Works for Achieving Alpha)
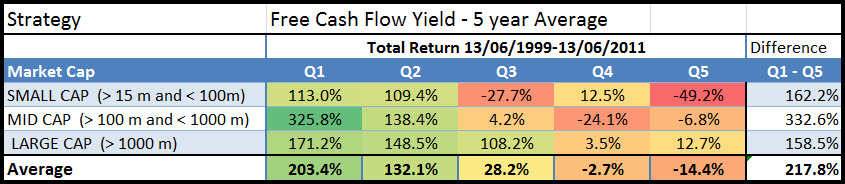
Click image to enlarge
Free Cash Flow Yield – 5 year average returns (Source: Quantitative Value Investing in Europe: What Works for Achieving Alpha)
Q1 (Quintile 1) represents the cheapest 20% of companies and Q5 (quintile 5) the most expensive.
Free Cash Flow Yield Trailing 12 months was better
Even though using the 5-year average FCF yield on mid cap companies (Q1) would have given you a higher return than the 12-month FCF yield, the results for the other market size companies would have been a lot lower.
Free Cash Flow Yield 12 months also was stronger ration than Free Cash Flow Yield – 5 year average because of the larger difference (257.8%) between Q1 and Q5 returns than 217.8%.
Odd was that average returns for FCF 12 months returns from quintile one (Q1) to quintile 5 (Q5) was not linear – Q5 returns were higher than Q4 – this makes the ratio a bit weaker compared to FCF 5 year average.
Substantial market outperformance
Just in case you were wondering - market outperformance for both ratios was substantial, over the 12-year period of the study, the market portfolio generated a return of only 30.54 % or 2.25% pa, dividends included.
Summarised results
In the table below I averaged the total returns for large, medium and small companies for all quintiles and sorted the strategies by Q1 (most undervalued or highest ROIC) values.
As you can see the Free Cash Flow trailing 12 months performed by far the best with the following three ratios close together.
Free Cash Flow trailing 12 months was also – and strongest ratio – as it also had the biggest difference between Q1 and Q5 returns (257.8%) – it was however not 100% linear from Q1 to Q5.
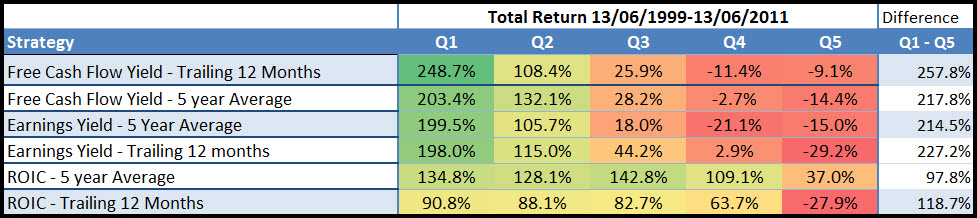
Click image to enlarge
12 months vs 5 year normalized returns sorted from high to low by Q1 returns
Click here to start using Free Cash Flow Yield in your portfolio Now!
How you can improve the returns of a free cash flow yield investment strategy
In the above research report we not only tested single valuation ratios, we also tested if you can improve returns further by combining free cash flow yield with other ratios.
Improve your free cash flow yield returns
The following table shows you the returns you could have achieved if you can combined high 12 month free cash flow yield companies with other ratios and indicators.
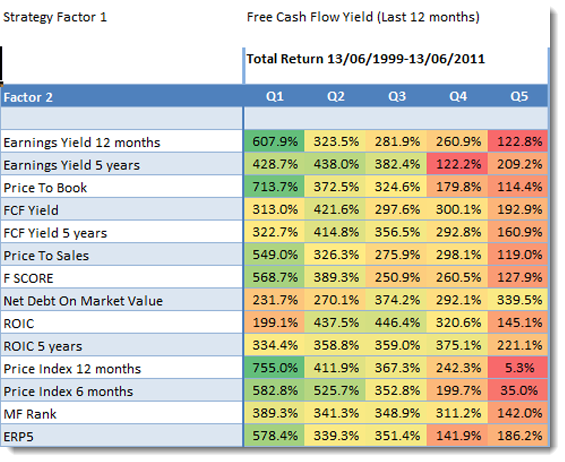
Source: Quantitative Value Investing in Europe: What works for achieving alpha
Look at column Q1
Look at the returns in column Q1, it shows the returns generated by first selecting the 20% best free cash flow yield companies combined with the ratios in the column called Factor 2.
Best combination +755% was Momentum (506.3% improvement)
As you can see the best way to increase your return (+755.0%) was to combine free cash flow yield with Price Index 12 months (12 months momentum).
Price index 12 months is calculated as the current share price / share price 12 months ago.
This means if you invested only in the 20% of high free cash flow yield companies that also had the top 20% 12 months price index you could have increased your return by 506.3% (755.0% - 248.7%) compared to if you only invested in companies with the highest free cash flow yield.
That is an improvement of just over 2 times the original return!
Even more back tests
You can find more back tests of the FCF yield in the US, UK and Europe here: Free Cash Flow Yield: How to Find the Best Value Stocks
Click here to start using Free Cash Flow Yield in your portfolio Now!
So free cash flow works how can I find investment ideas?
Now for the interesting part where I show you exactly how to find free cash flow yield investment ideas for your portfolio.
We have set it up for you
We have already saved a free cash flow yield screen for you so all you have to do is load it.
Here is how you do it:
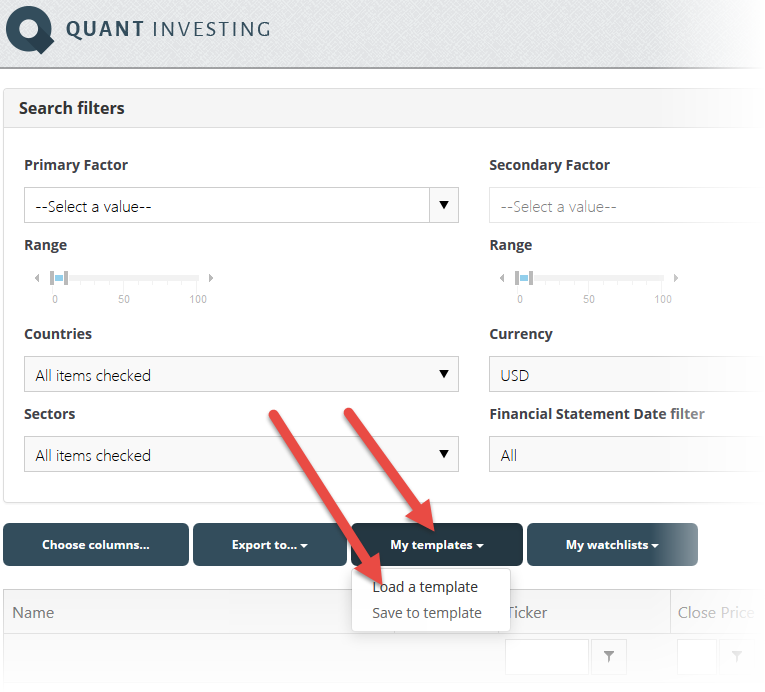
After logging into the screener click the My templates button then click the Load a template menu item as shown below:
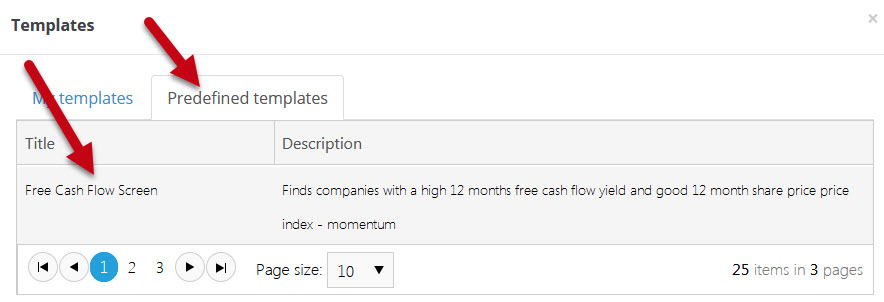
Then click on the Free Cash Flow Screen saved screen in the Predefined templates tab.
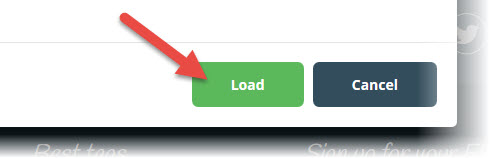
Once you have selected the screen scroll to the bottom of the page and click the Load button.
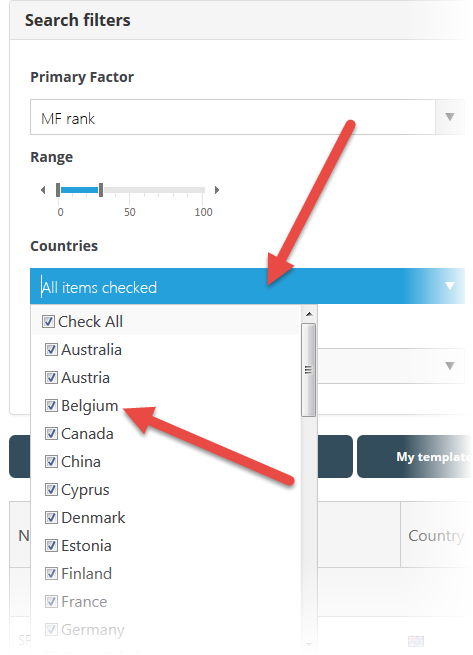
Select your countries
You then have to select the countries where you would like to search for investment ideas.
To do this click the drop down list item below Countries and check all the countries you would like to select.
Select value and volume
Next you have to enter the minimum daily trading volume and the minimum market value of the companies you want to screen for.
Important: The numbers you enter are in thousands, this means if you enter $100 it is equal to $100,000.
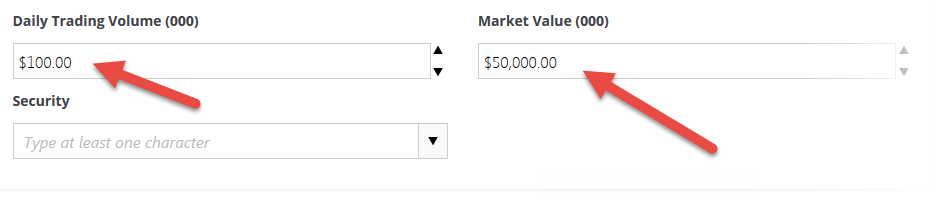
That is all you have to do.
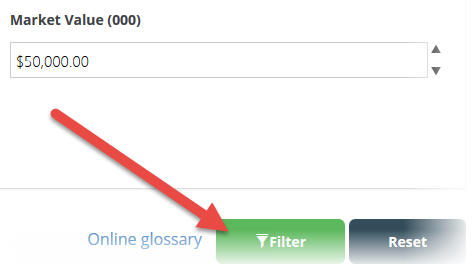
When you are done click the Filter button to get your investment ideas.
You can save all your screens
Once you have changed the basic free cash flow yield screen to fit your investment style you can save it so that you can call it up at any time with a few simple mouse clicks.
You can save as many screens as you like.
To save your screen click the My template button, then the Save to template menu item.
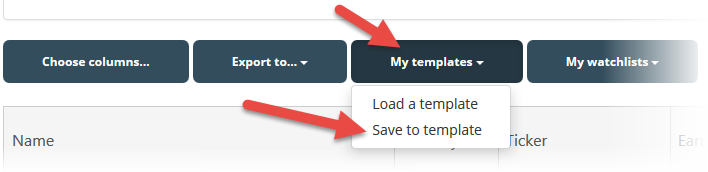
In the pop-up box give your screen a name and a short description so you can remember what you included in the screen.
All this costs less than a lunch for two
How much does a tool like this cost, you may be thinking?
To make it affordable, and give you a great return on your investment, even if your portfolio is still small, we have made the price of the screener surprisingly low.
It costs less than an inexpensive lunch for two each month (Click here to sign up right now).
Don’t hesitate, you have nothing to lose. If you are not 100% satisfied you get your money back – no questions asked!
PS: Why not sign up now, while this is fresh in your mind?
Click here to start using Free Cash Flow Yield in your portfolio Now!
