

We have just added the Parabolic Stop and Reverse trend indicator to the Quant investing stock screener. It is a great indicator to help you get better entry or exit prices – so keep reading.
First a bit of background information.
What is a Parabolic Stop and Reverse indicator?
The Parabolic Stop and Reverse (Parabolic SAR or PSAR) is a technical trend indicator developed by J. Welles Wilder Jr. to help you identify reversals in stock price direction. It is a lagging trend-following indicator that can help you set a trailing stop loss or show you buy or sell points.
It is based on the idea that prices tend to stay within a parabolic curve during a strong trend and unless a stock continues to generate more profits over time , it should be sold.
It works best with stocks or in markets with a strong trend and may generate a lot of buy and sell signals (whipsaws) if a price moves sideways or trades in a range.
Click here to start using the Parabolic SAR indicator in your portfolio NOW!
How is it calculated?
The Parabolic SAR is calculated independently for each price trend and uses the highest and lowest price as well as the price acceleration factor (AF) to calculate where on a chart the PSAR indicator dot will be displayed.
At each step in a trend, it is calculated one period in advance. That means tomorrow's value is calculated using today’s data.
The formula for the Parabolic SAR is as follows:
Uptrend
When the price is in an uptrend, the Parabolic SAR starts below the price and moves up towards the price.
Uptrend Parabolic SAR = Prior SAR + Prior AF (Prior EP – Prior SAR)
Downtrend
When a price is on a downtrend, the Parabolic SAR starts above the price and moves down.
It is calculated as follows:
Downtrend Parabolic SAR = Prior SAR – Prior AF (Prior SAR – Prior EP)
Where:
EP is the extreme point of a trend (highest price in an uptrend or lowest during a downtrend). Each time if a new maximum (or minimum) is recorded, the EP is updated with that value.
AF is the acceleration factor. It is initially set at 0.02 and increased by 0.02 each time the EP is reached. It has a maximum value of 0.20.
How the PSAR is displayed
The Parabolic SAR indicator is shown on a chart as a series of dots with the current stock price.
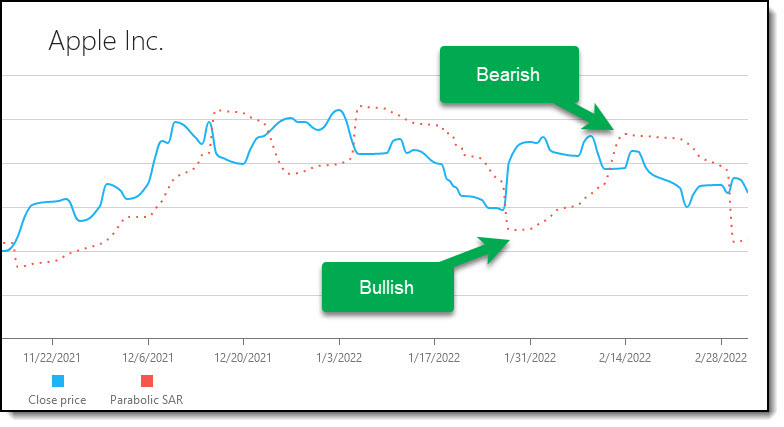
Click image to enlarge
Parabolic Stop and Reverse (red dots) shown with the closing price of Apple Inc.
Below is bullish
If it appears below the current price, the Parabolic SAR is interpreted as a positive (upward trend) and is a buy or bullish signal.
Above is bearish
When it is appears above the current price, it is deemed a negative (downward trend) and a sell or bearish signal.
A change in the direction of the dots produces buy or sell signals that can produce a profit when the price makes big swings.
Important! The indicator is not reliable if the price movement is flat or if it trades in a range – moves between an upper and lower limit.
Setting stop losses and or buy prices
The dot above or below the current price signals can be used to set stop losses or buy signals. For example:
To set a stop loss level
If the stock price is moving up and the PSAR is below it (positive trend) you can set your stop loss at the PSAR value. This means if the price falls below the PSAR value you sell.
Click here to start using the Parabolic SAR indicator in your portfolio NOW!
To set a buy price
You can use the PSAR to better time the price you buy at, and this even if you are a long-term investor.
If the PSAR value is above the stock price, the price trend is negative. You can better time your buy decision by waiting for the price to break up through the PSAR value.
This means the down trend has been broken. This gives you a lower buy price and positive trend you are investing into.
The PSAR in the stock screener
The Quant Investing stock screener gives you two possibilities to use the Parabolic SAR indicator:
- In a chart
- As an output column of a screen
In a chart
To see the PSAR indicator in chart form click on a company name to go to the company dashboard, then scroll down until you see the closing stock chart (blue line). The Parabolic SAR is shown as a second red dot chart.
Below the PSAR indicator is below the closing chart – a positive or bullish indicator.
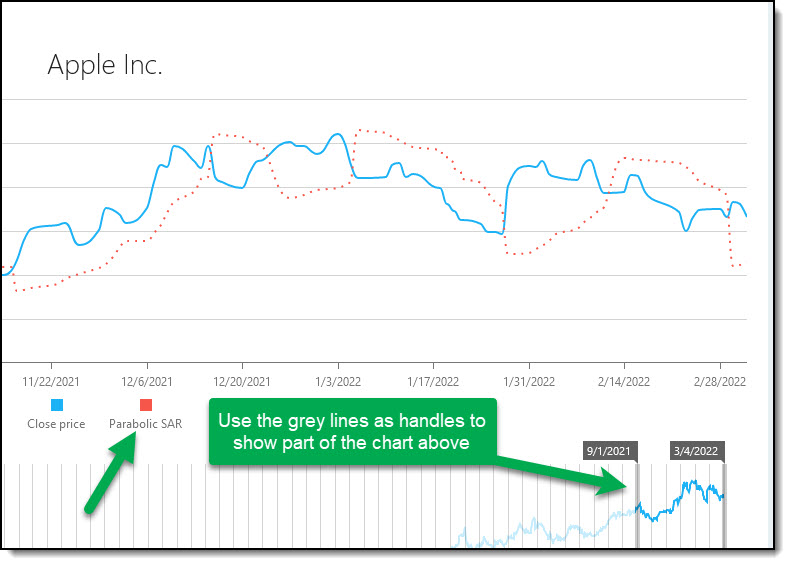
Click image to enlarge
As an output column of a screen
You can also show the PSAR indicator for all the companies in a screen or Watchlist by selecting it as an output column.
To do this:
1. Click the Add/Remove columns icon
2. Click the Technical heading
3. Tick the box next to PSAR/Close
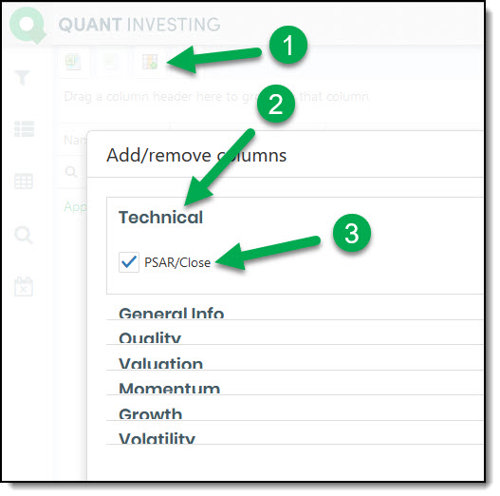
How to select Parabolic SAR as a screener output column
PSAR/Close formula
The formula for the PSAR/Close indicator is the current Parabolic SAR value divided by the last close price times 100, to show it as a percentage.
Remember if the PSAR/Close value is greater than 100% it is negative and the other way around.

PSAR/Close value as an output column
How you can use it
When you run a screen or call up a Watchlist, select the PSAR/Close as an output column.
It helps you to quickly see what stocks are in a bullish or bearish trend.
Get it emailed to you
To help you get better buy or sell prices you can of course also get the indicator emailed to you, as often as you like.
To do this build a Watchlist, include the indicator in the output columns you would like to see, and select how often you would like to get the Watchlist emailed to you.
Click here to start using the Parabolic SAR indicator in your portfolio NOW!
