

We just added a variable Simple Moving Average (SMA) ratio to the Quant Investing stock screener.
The Simple Moving Average ratio is variable which means you can select the exact number of trading days you would like to have. For example, 50, 100 or 200 days.
How is it calculated?
The variable Simple Moving Average ratio is calculated as:
Current stock closing price / Variable Simple Moving average value.
What it means
A simple moving average value of greater than one means the closing stock price is above the Simple Moving Average you selected.
A value less than one means the last closing stock price is below the Simple Moving average.
How to add a SMA indicator
It is very easy to add your own SMA indicator to any of your screens. Simply type the number of trading days in the box below SMA as shown below.
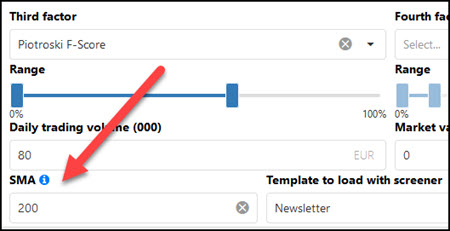
Note : Due to the added calculations, adding a SMA indicator to your screen will make the screener response time a bit slower.
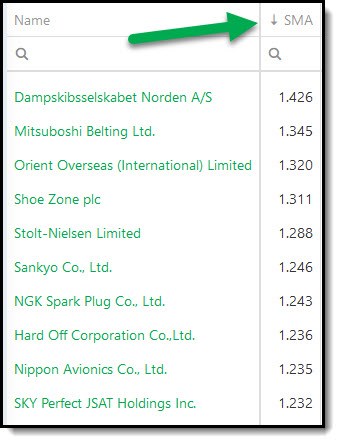
An SMA output column is automatically added
After adding a SMA value, as soon as you click the Apply button the SMA column will automatically be added to the results of your screen.
The same as all columns in the screener you can sort this column by clicking on the column heading – SMA in this case.Clicking once will sort the column from low to high. Clicking a second time will sort the column from high to low.
Remember:
A SMA value of >1 means the closing stock price is above the SMA you selected.
A SMA value of <1 means the last closing stock price is below the SMA.
PS Not a subscriber yet? To find the best investment ideas using the SMA ratio as well as 110 other ratios and indicators (for less than an inexpensive lunch for two) click here: Join today
PPS It is so easy to forget and put things off why don’t you sign up right now?
