

Would you be interested in an indicator that tells you how many companies (in 36 world markets world-wide) are moving up and down? As an experienced investor you know I am talking about market breadth.
Market breadth
Market breadth is an indicator that shows you how many companies are moving up in price compared to how many companies are moving down.
It shows you the overall direction of the market.
For example, in a healthy rising market there should be more rising stocks compared to stocks falling in price. If this is not so you should question the strength of the increase in the market.
Positive (upward or rising) market breadth
Market breadth is positive or rising when more stocks are moving higher than are moving lower. When this happens you can say that the upward movement of the market is healthy.
Because market breadth does not just look at the movement of a few high weighted index stocks, it gives you a much better overview of the market's overall trend and condition.
It is therefore closely watched by traders.
Also useful for long term investors
But market breadth can also help you if you are a long term investor. For example if the market breadth is weak (more stocks declining than rising) you may want to wait with your buy order as the market may fall allowing you to buy at a lower price.
The same applies if you want to sell and the market breadth is healthy (mores stocks rising than falling) you want to wait because the price has a high probability of moving higher.
36 markets worldwide
This new report, available to all subscribers, shows you exactly how many companies are moving up and down in 18 markets (36 if you count the Eurozone countries separately) world-wide.
To exclude small companies that do not trade much we only included companies with a market value higher than the median value (middle market value) in each country or region.
The following countries are included:
- Australia
- Canada
- China
- Czech Republic
- Denmark
- Eurozone (19 countries)
- Hong Kong
- Japan
- Malaysia
- New Zealand
- Norway
- Poland
- Singapore
- South Korea
- Sweden
- Switzerland
- UK
- USA
This is what it looks like
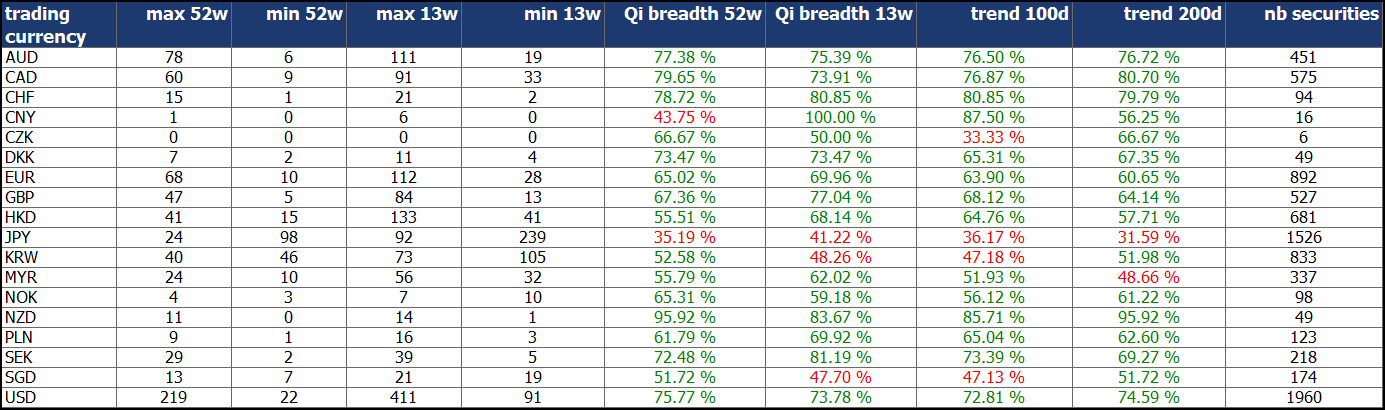
This is what the report looks like:
Click to enlarge
What it all means
The headings look a bit cryptic but are easy to understand. This is what each column means:
Max 52w
Shows you the number of companies with its share price at a 52 week high, one year highest share price.
Min 52w
Shows you the number of companies with its share price at a 52 week low, one year lowest share price.
Max 13w
Shows you the number of companies with its share price at a 13 week high.
Min 13w
Shows you the number of companies with its share price at a 13 week low.
Qi breadth 52w
The Qi Breadth 52w column shows you the percentage of companies where the last closing price is closer to its 52 week (one year) high price than its 52 week lowest price.
For example, if the price of a stock is €60 and its highest price over the past 52 weeks was €70 and its 52 week lowest price was €15.
At a price of €60 it is closer to its 52 week high than its 52 week lowest price.
This means the company is classified as a company with positive market breadth.
Qi breadth 13w
The Qi Breadth 13w value shows you what percentage of company’s current share price is closer to its 13 week highest price than its 13 week lowest price.
For example, if the price of a stock is €60 and its highest price over the past 13 weeks was €70 and its 13 week lowest price was €40.
At a price of €60 it is closer to its 13 week high than its 13 week lowest price.
This means the company is classified as a company with positive market breadth.
Trend 100d
Shows you the percentage of companies with a share price above their 100 day moving average.
Trend 200d
Shows you the percentage of companies with a share price above their 200 day moving average.
nb securities
Shows you the number of companies included in the calculation of all the above values.
Remember, to exclude small companies that do not trade much we only included companies with a market value higher than the median value (middle market value) in each country or region.
Where can you find the report?
We have added the report to the Dashboard page on the website.
After you have logged in, scroll down and click on the Go to Dashboard button.
Scroll down on the next page to the bottom of the page and click on the file called “Market breadth”
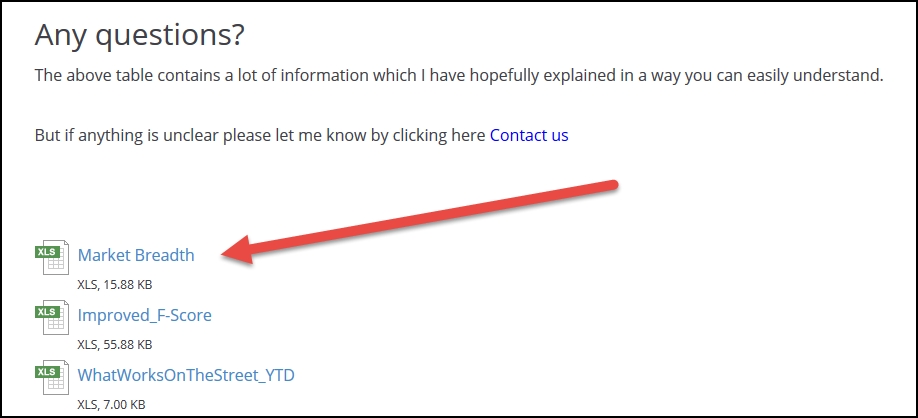
What are in all the other files?
Along with this file you will see a lot of other files.
To find out more on how you can profit from the information in these files take a look at the following article: These new tools will give you even more good investment ideas
PS To get immediate access to this report at a cost of less than an inexpensive lunch for two, click here: Sign me up
PPS It is so easy to forget, why not sign up right now?
