Mastering Volatility: The Secret to Long-Term Investment Success

Discover why steady investment returns consistently outshine wild swings in our latest article. Dive into portfolio updates and explore why a diversified strategy can pave the way to long-term success.

This is the editorial of our monthly Quant Value Investment Newsletter, published on 2023-09-05. Sign up here to get it in your inbox the first Tuesday of every month.

More information about the newsletter can be found here: This is how we select ideas for the Quant Value investment newsletter


This month you can read why steady always beats wild returns.

But first the portfolio updates.


Portfolio Changes

Europe – Buy Two – Sell Two

Two new recommendations this month as the index is above its 200-day simple moving average.

The first one is a debt free France-based producer, packager, and marketer of poultry products trading at 10.0 times Earnings, Price to Free Cash Flow of 9.1, EV to EBIT of 5.8, EV to Free Cash Flow of 7.6, Price to Book of 1.2.

The second is an Italian automaker, also with net cash on its balance sheet,  trading at ONLY 2.7 times Earnings, Price to Free Cash Flow of 3.7, EV to EBIT of 1.3, EV to Free Cash Flow of 2.1, Price to Book of 0.7 and pays a dividend yield of 8.1%.


Stop Loss – Sell

Sell Bijou Brigitte Modische Accessoires Aktiengesellschaft at a loss of 6.3%

Sell PCC Rokita SA at a loss of 5.6%


North America – Buy Two – Sell One

Two new recommendations this month as the index is above its 200-day simple moving average.

The first is a nicely undervalued US-based designer and manufacturer of products that power, protect, and connect electronic circuits. It is trading at Price to Earnings ratio of 8.9, Price to Free Cash Flow of 11.3, EV to EBIT of 7.2, EV to Free Cash Flow of 11.6, Price to Book of 2.1.

The second is a surprisingly stable US home developer and builder trading at 5.2 times Earnings, Price to Free Cash Flow of 3.6, EV to EBIT of 4.6, EV to Free Cash Flow of 4.4, and Price to Book of 1.0. It does not pay a dividend but last year bought back 8.8% of its shares outstanding!


Stop Loss – Sell One

Sell Supremex Inc. at a loss of 30.0%


Asia – Buy Two – Sell One – Hold Two

Two new recommendations this month as the index is above its 200-day simple moving average.

The first is a REALLY undervalued Japanese logistics business trading at Price to Earnings ratio of 4.3, Price to Free Cash Flow of 3.5, EV to EBIT of 3.1, EV to Free Cash Flow of 3.6, Price to Book of 0.5 and pays a dividend yield of 3.9%.

The second is a Japanese construction company with more cash on its balance sheet than its market value (negative enterprise value!). You thus pay for the cash and get a business trading at Price to Earnings ratio of 9.2, Price to Free Cash Flow of 1.1, EV to EBIT of -2.0, EV to Free Cash Flow of -0.5, Price to Book of 0.5 and pays a dividend of 3.6% for free.


Stop Loss – Sell One

Sell Look Holdings Incorporated at a loss of 11.8%


Hold - Two

Continue to hold SAN Holdings Inc. +98.9% (recommended September 2020), and Fuji Corporation +52.0% (recommended September 2022), as they still meet the portfolio’s selection criteria.


Crash Portfolio – Hold Two

No new Crash Portfolio ideas as most markets have recovered.

To date the 15 Crash Portfolio ideas, recommended since August 2022, are up an average of 21.5%!


Hold - Two

Continue to hold CNOOC Limited +41.5% and Stella International Holdings Limited +11.3% (both recommended September 2022), as they still meet the portfolio’s selection criteria.


Tortoise Beats the Hare: Why Slow and Steady Wins the Return Race

This month I would like to show you why steady returns are much better than wild and extreme movements.

When we talk about investment success, most people mention wild returns over short periods. But as you know this is mentioned by beginners.

As an experienced investors you know you must look at another, much more important factor, which is how much these returns fluctuate.

This is crucial for your long-term investment success.


Hare and tortoise investments compared

Let's look at two investments, A and B, both have an average annual return of 10%.

Investment A gives 10% returns each year for two years, growing your $100 to $121.

Investment B has a bumpy ride, with a -50% loss in the first year but a 70% gain in the second, still averaging 10% annually.

BUT a $100 investment in B would only grow to $85 after two years due to wild movements and the sequence the movements took place.

The difference shows you how volatility affects the overall return. Mainly how high volatility can drag down your long-term performance.


Why is it important to limit large losses?

It is especially important that you avoid large losses.

Why is best shown with the following table:

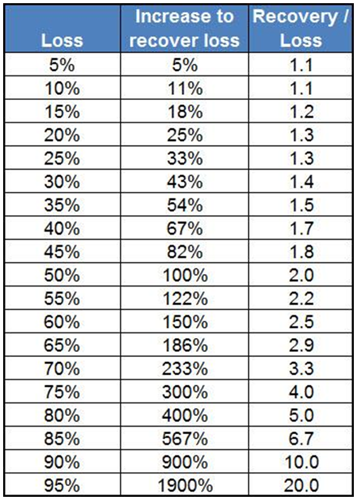
The table shows the return you must generate (column 2 "Increase to recover loss") to recover from the "Loss" in column 1.

A 5% loss is still easy to recover from. But if you suffer a 20% loss you need a return 1.3 times (column 3) the loss to recover your investment.


It only gets worse

Should you suffer a 60% loss you need a return 150% or 2.5 times the loss to recover your capital.


Diversification helps

Diversification help you counter this effect, as shown when comparing the S&P 500 with individual stocks like Tesla for example.

Stocks like Tesla may have higher short-term gains, but their wild ups and downs lead to lower overall returns over longer time periods.

While you may fear missing out on big winners by diversifying, the REAL benefit you get is having lower losses during downturns.


Wild losses need big returns

As mentioned, if you have a wild loss, you must have a big return to make up for the loss. But you know large gains are hard to find.

And you do not know if the stock that gave you the large loss will have a big gain again.


Just look at the return of the companies recommended in the newsletter:

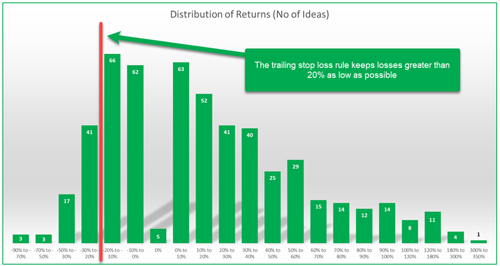
Of the over 500 companies recommended you can see there were a few large returns, 24 of over 100% but most of the returns were between 0% to 40%.

Also notice how the strict stop loss keep losses low, the chart left of 0% is a lot shorter.


Summary and conclusion

So, what does this mean for our portfolio?

Slow and steady returns from a well-diversified portfolio outperforms wild returns over time AND it lets us sleep better.

That is why the newsletter recommends no more than 2% positions worldwide. It’s the easiest and best way to diversify your portfolio.

It is also the reason why you should only smile when a friend talks about wild gains he made in some single stock or high-risk crypto investment.

His overall long-term return is very likely below what you achieved with your well diversified portfolio. And you slept comfortably, every night.

What’s not to like about that?


Reading Recommendations

Why international diversification is STILL a great idea

In July Michael Kitces published a great guest post Why International Diversification Is Still The Prudent Strategy by Larry Swedroe, head of financial and economic research at Buckingham Strategic Wealth.

Larry discusses why many investors tend to fall prey to recency bias and explains why global diversification – and keeping short- and long-term results in the right perspective – remains a prudent strategy.

Executive Summary
One common argument made by investors who refrain from global diversification is that, during systemic financial crises, everything does poorly, leading them to question the protection that international diversification offers during large market declines. While research may support this argument – that worst-case real returns for individual countries do tend to correspond with severe declines across all countries globally – the trend generally holds true only for the short term and the similarities in market behavior for countries around the globe tend to deteriorate over the long-term, as different countries naturally recover at different rates.
But because no one can be sure of when and where these recoveries will happen, investors who are willing to spread the risk of slightly lower returns from globally diversified portfolios stand to yield the rewards of having an edge in the natural cycle of global markets in the aggregate.
Contrary to the view that global diversification may offer little protection from market declines, it is especially salient in cases of a worldwide recession – while the average individual country’s returns after such an event tend to stay depressed, global portfolios go on to eventually recover. In other words, while global diversification may not necessarily provide protection from the initial crash, it does create the potential for a significantly faster recovery. And this behavior tends to be more pronounced with longer time horizons – which are ultimately more relevant for investors with long-term wealth goals.
For example, a strong case has been made for the predictive value of the CAPE 10, a price-to-earnings metric designed to assess relative market valuation, which is especially insightful when it comes to long-term returns. As while investment returns can be driven by underlying economic performance, such as through growth in earnings, they can also be driven by changes in valuations. And even though timing markets based on valuations in the short-term has not proven to be a successful strategy, the CAPE 10 has been positioned as a useful predictor of long-term future returns. Given the current (as of March 2023) economic positions for the U.S. CAPE (at 3.4%) and the EAFE CAPE 10 (5.6%), unless these values change, investors can reasonably estimate EAFE markets to outperform the S&P 500 by 2.2% annually.
Ultimately, the key point is that when evaluating for diversification, many investors can be prone to behavioral biases that preclude them from maintaining a well-diversified risk-appropriate portfolio that relies on a mix of U.S. and global investments.
But by helping clients develop a clear understanding of the actual risks of diversification and a healthy perspective of historical market performance, advisors can prepare their clients to stay disciplined and focused on long-term results, ending out as both more informed and more insulated against inevitable market dips!
 

2023 Have given Bulls and Bears a story

In August Discipline Funds published an interesting article 2023 – The Year That Gives Everyone a Narrative where they argue that the current market is so strange that there’s a “story” for just about everyone.


Permabears can argue:
  • Industrial production has slowed to 0%.
  • PMI has been contracting all year.
  • Retail sales have slowed to 0.5%.
  • Housing starts and mortgage applications are down 40-50%.
  • Inflation adjusted commercial real estate is down 20%.
  • Inflation adjusted residential real estate is down 5%.
  • The stock market has been negative for two years and is still down -14% adjusting for inflation.
  • Equal weight S&P 500 is up 8% in 2023. The Dow is up 7%. Both of which are barely on pace to beat T-Bills.
  • REITs and broad real estate market indices are down -25% from the 2022 highs.
  • The regional bank index is still down -16% year to date and -29% from the highs.
  • Core PCE inflation is still 4%+, double the Fed’s target.
 
Permabulls can argue:
  • Real GDP has averaged 4% for two years.
  • Monthly payroll growth has averaged 422K for two years and 258K in 2023.
  • Nominal residential home prices are barely down.
  • Housing starts and construction bottomed late in 2022.
  • The Nasdaq is up 40%+ this year.
  • The S&P 500 is up 17.75% this year.
  • Homebuilders are up 40% this year.
  • Regional banks are up 35% since the banking panic in May.
  • Headline inflation has fallen from 9% to 3%.
More importantly, we know that environments with low unemployment, high valuations and restrictive credit are consistent with poor risk adjusted returns in the stock market.
The last 7 months of performance doesn’t change that.
And more importantly, all of this creates an environment that is ripe for hyper emotional narratives, fear/greed and uncertainty. The good news is you don’t have to take a lot of long duration risk to create certainty in an environment where T-Bills yield 5.5%. And having a good time based financial plan can help you compartmentalize your assets in a manner that helps you avoid the sort of binary thinking that often leads to catastrophic investing mistakes.
1 – A better example here is a 10 year AAA rated bond yielding 4%. You can trade that instrument over 10 years until the cows come home, but you cannot make that bond yield more than 4% per year on average. Yes, some traders will earn more/less than 4% as they try to time the price changes, but on average the traders of that instrument will earn 4% before taxes and fees and no more. The same general story is true of the stock market over long periods of time.
2 – It sounds counterintuitive but the stock market’s largest drawdowns typically occur in environments where unemployment is LOW, credit tightens and valuations are high. This combo is a recipe for bumpy stock returns as seen in the last 24 months.


Not a subscriber? Click here to get ideas from the BEST strategies we have tested NOW!