

This article gives you a quick introduction to the Quant Investing stock screener and its features.
Take 5 minutes to read it, it will get you up to speed to get the most out of your subscription
How to log into the screener
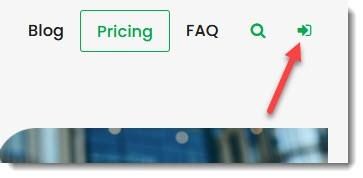
To start you must log into your account. To do this go to www.quant-investing.com Click on the Subscriber Login icon at the top right of your screen.
Enter your login details and click the Login button.
On the next screen click on the Go to Screener button
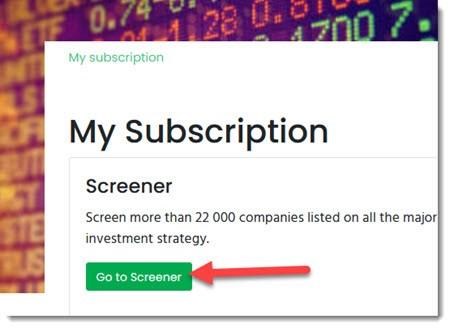
If you do not see the Go to Screener button click on this link (after you have logged in) to go there: My Subscription link
This will take you to the screener page.
The stock screener
The next page looks like this:
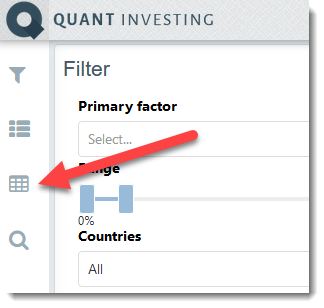
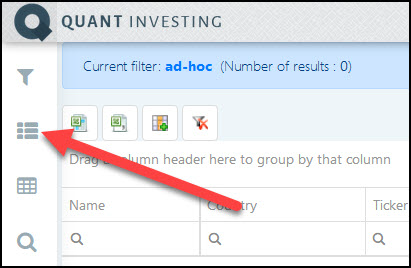
The four icons on the left are where you find the main functions of the screener which are:
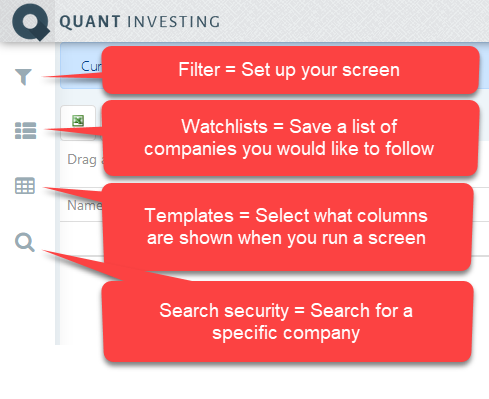
Always use at least one slider
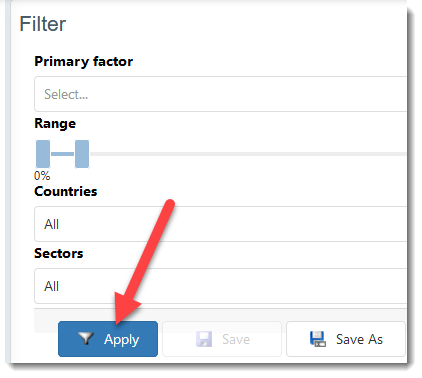
The functionality of the screener is based on the use of the four sliders at the top of the screener page as shown below:
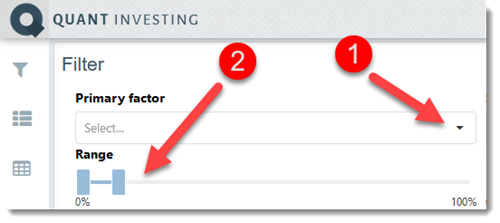
In order to get any output from the screener you must use at least one of the sliders.
To start the screener - get a list of companies
To get a list of companies that match the criteria you have selected click on the Apply button.
Choose and save only the columns you need - Templates
The screener allows you to save the output columns you would like to see with each Screen.
This is called a Template.
This means you can save different columns you would like to display in different Templates.
For example a “Value” template with value ratios and indicators and a “Momentum” Template with momentum indicators.
To save your first Template first click on the Templates icon.
You will see a few columns are already selected for you as a default. You can however change these and create as many Templates as you like.
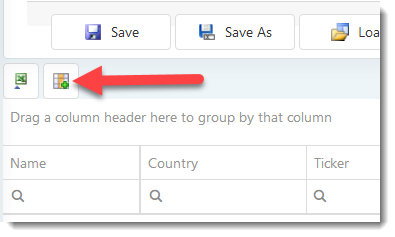
Too add or remove columns click on the Add/remove columns icon:
To add a ratios or indicators simply click on any of the headings and then click the box next to the ratio you would like to select.
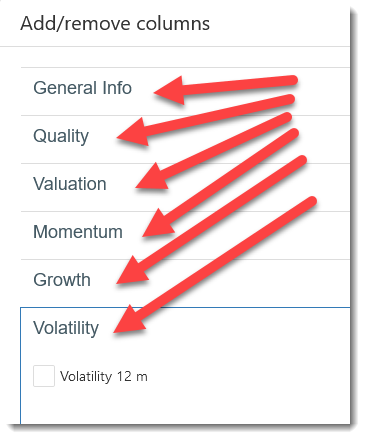
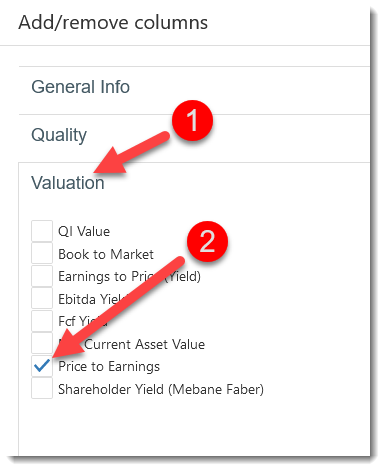
The same way you can unselect the tick marks next to all the indicators you do not need.
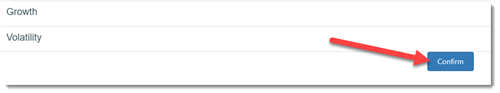
To save your selection first click on the Confirm button at the bottom of your screen.
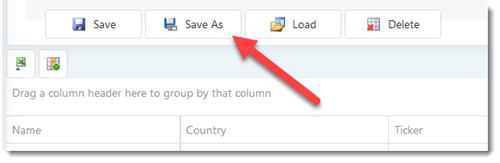
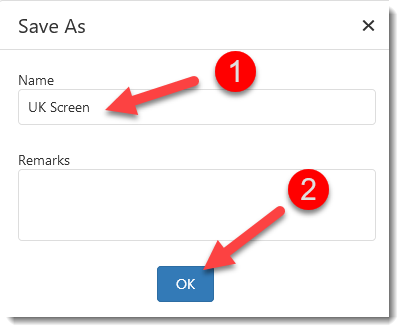
Then to save your Template click on the Save As button, give your new Template a descriptive name, then click the OK button to save the Template.
How to link Templates to your stock screen
Templates are saved separately – which means you can save as many as you like.
You can however also save a Template so that it is loaded automatically when you load a screen.
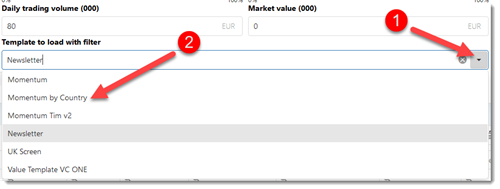
To do this click on the drop-down arrow in the box below the heading Template to load with screener.
From the list that appears select the Template you would like to load.
Remember to click on the Save button to save the template you have linked to the screen.
How to load a different Template with your screen
Even though you have linked a Template to a Screen does not mean you cannot load any other templates with it.
To show a different Template with your stock screen do this:
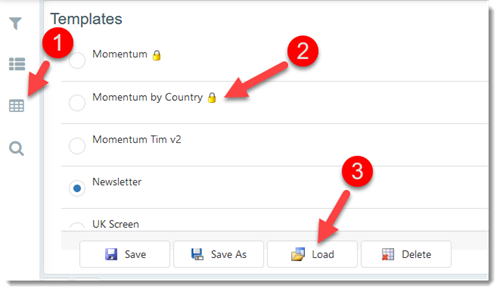
- Click on the Templates icon
- Click on a template to select it
- Click the Load button to load the Template
This means that with every Screen you run you can select any Template you have saved.
Change the sequence columns are displayed
You can easily change the sequence columns are displayed.
To do this simply:
- Move your mouse over a column heading,
- Left mouse click on the column heading and
- Drag it to the left or right.
A line will show you where the column will be moved to.
Save your screen
You can save any screen you have created, including the Template you have linked to the screen by clicking on the Save As button.
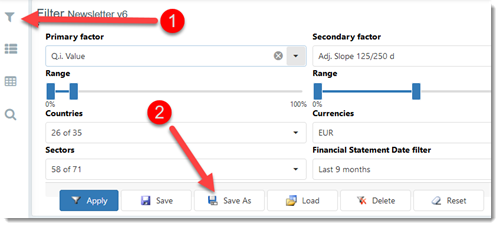
When you save the screen the Template link is also saved. This means the columns selected as well as the column sequence from left to right will also be saved.
If you click the Save button the screen you loaded will be overwritten with any changes you have made.
Load your own or a pre-defined Screen
The fastest way to get started is to use one of the screens we have saved for you.
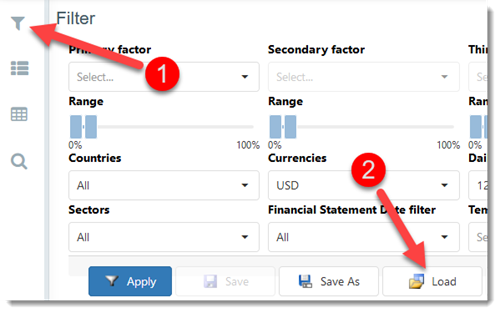
To load a pre-defined screener template first click on the Screen icon and then on Load button:
To load your own screen:
- Click on the My screeners tab
- Click on one of the screens to select it
- Click on the Confirm button to load the screen
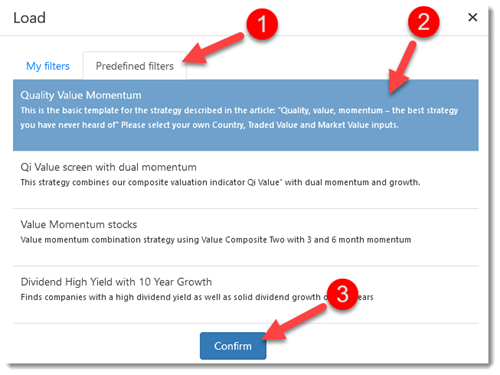
To load a pre-defined screen:
- Click on the Predefined screeners tab
- Click on one of the screens to select it
- Click on the Confirm button to load the screen
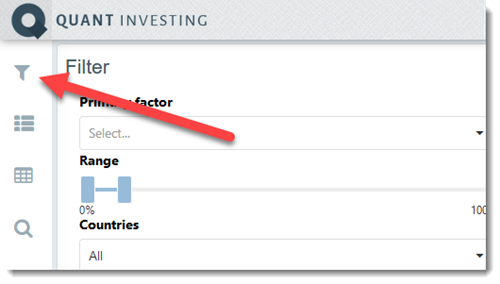
Hide the screener criteria
As you may have seen the screener criteria box is quite big.
After you have run your screen you can hide the box to focus on the companies you have selected.
To do this click on the top left Screener icon:
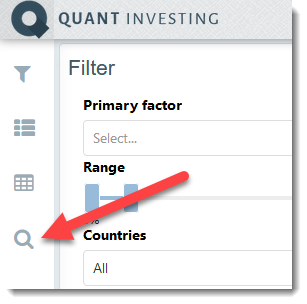
Find a specific company in the screener
If you want to find information about a company, for example its valuation or Piotroski F-Score this is easy to do.
Click on the Search security icon.
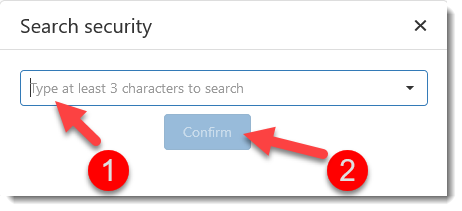
As soon as you start typing the company’s name a list of names that fit with what you have typed will appear below the box.
If the company you are looking for does not appear, just keep typing.
Once you have clicked on the company you are looking for click the Confirm button.
How to get more information on a company
If you look at the results of any Screen you will see the company’s name is written in colour – this is because it is a hyperlink you can click on to get more information on the company.
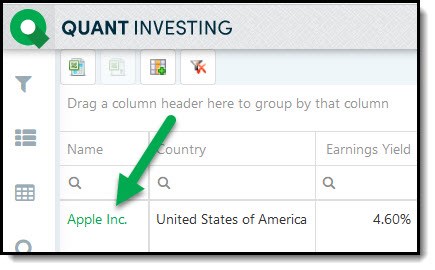
After you clicked on the company name a page will open with a lot of company specific ratios and indicators.
If you ran a screen and clicked on one of the companies the Ranking section will show you where the company is positioned within all the companies found with the screen.
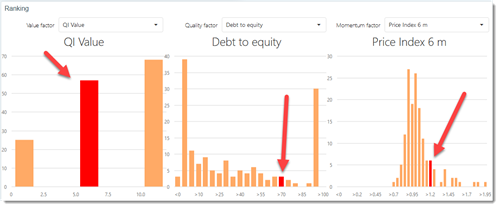
The company’s ratios are shown in bright red.
The ratios and indicators can also be changed by clicking on the drop down lists above each chart.
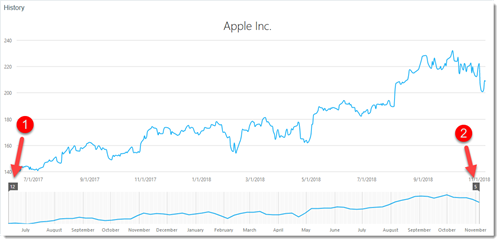
At the bottom of the page you will see a price chart which you can change with the two sliders shown as 1 and 2 below.
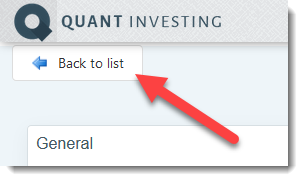
To get back to the screen or the company you called up click the Back to list buttons at the top and bottom left of the page.
How to create a Watchlist and add companies
A Watchlist is a list of companies you select that you can call up with a few mouse clicks.
For example, your own portfolio or companies you would like to keep track of.
You can also select exactly what ratios and indicators are shown when you call up the Watchlist.
You do this by saving and loading a Template. See the separate section on Templates in this document.
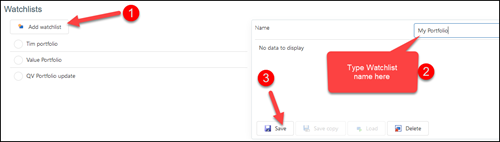
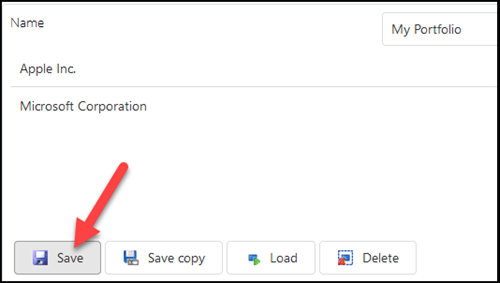
To create a Watchlist click on the Watchlists icon:
- Click on the Add watchlist button,
- Type in the name you want to give your Watchlist in the text block next to Name,
- Click the Save button to save your Watchlist
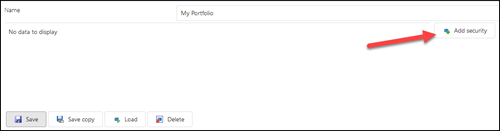
To add a company to your Watchlist click the Add security button:
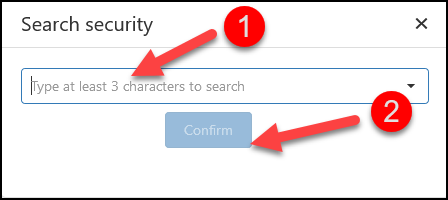
Type at least the first three characters of the company’s name into the search box. A list of matching companies will appear in a drop down list. Keep typing to refine your search.
Once you have found the company you want to add click on its name then click the Confirm button.
Don’t forget to Save your Watchlist after you have added all the companies to it.
How to load your Watchlist
To open a Watchlist click on the Watchlist icon:

Next click on the name of the Watchlist you want to load, then click the Load button
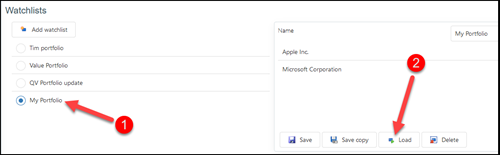
Your Watchlist will load with the current Template (columns that are displayed) you have selected.
To change the columns that are shown save the columns you want to display in a Template and select that Template after loading your Watchlist.
See the separate section on how to save a Template on how to do this.
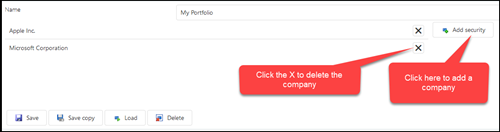
How to edit your Watchlist
Before you can edit your watchlist you have to load it. To do this look at the instructions in the section called How to load your Watchlist.
The following image shows you how to edit your watchlist.
How is a ratio or indicator calculated?
You can easily find information on exactly how all the ratios and indicators in the screener are calculated or defined.
To do that simply click on the i Online glossary link.
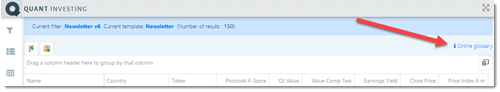
That will open a new browser tab that contains an exact explanation of all the ratios and indicators (sorted alphabetically) available in the screener.
To see the definition click on the ratio or indicator and the definition will open in a new tab.
Use the currencies you know
In the screener I am sure you have seen the currency field.
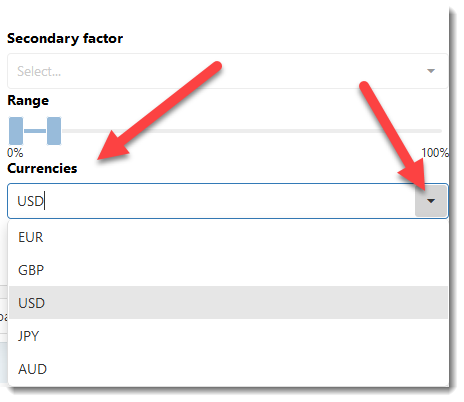
This field only sets the currency the screener uses in the Daily trading and Market capital fields.
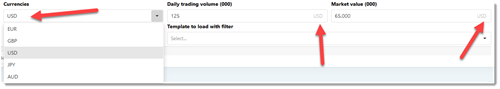
We included the currency field to make it easier for you to screen for companies using a currency you are familiar with.
For example if your investment currency is USD you can specify minimum Daily trading and Market capital values and then screen for companies worldwide and only companies with Daily trading and Market capital values greater the USD values you selected will show up on the screener.
Important: The Currency field does not have any other impact on the screener.
Export to Excel
The screener also allows you to export the results of any Screen you run to Microsoft Excel.
Before you can export to Excel you first have to run a Screen.
To export to Excel do the following:
Click the Export to MS Excel icon.
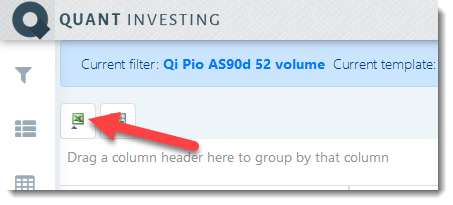
Once you have done that the page will either open in Excel automatically or you will have to select Open with Microsoft Excel from a menu that will open in your browser.
How to filter a column
You can easily filter the contents of just about all columns.
Before you can filter you have to call up your favourite screen.
For example, if you only want to see companies with an Earnings Yield greater than 10% this is how.
Type .1 (=10%) in the box just below the header Earnings Yield, then click on the small funnel to the left of the box.
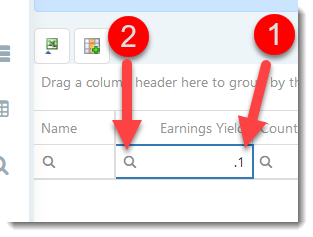
After you have clicked on the funnel, click Greater than on the menu that opens.
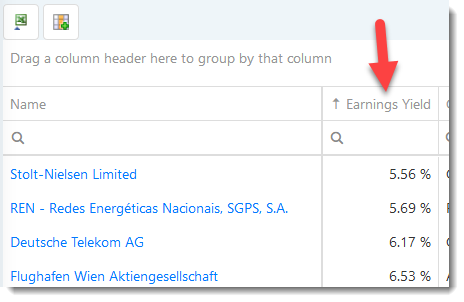
As soon as you have done that you will only see the companies with an Earnings Yield greater than 10%.
How to sort a column
To sort the values of a column from high to low or low to high put your cursor in the middle of the column heading and left mouse click on the column heading.
If you click once the column values will be sorted from low to high.
If you click a second time the column will be sorted from high to low.
Questions?
We hope you have found this article helpful. We are of course happy to answer any questions you may have.
To ask a question, just click the “Need help?” button at the bottom right of your screen.
