

This the editorial of our monthly Quant Value Investment Newsletter published on 2023-01-10. Sign up here to get it in your inbox the first Tuesday of every month.
More information about the newsletter can be found here: This is how we select ideas for the Quant Value investment newsletter
This month you can read all about the newsletter’s performance, in 2022 and since it was started over 12 years ago.
But first the portfolio updates.
Portfolio Changes
Europe – Buy Two
Two new recommendations this month as the index is above its 200-day simple moving average.
The first is a UK-based shipbroking company attractively undervalued, trading at Price to Earnings ratio of 6.0, Price to Free Cash Flow of 3.3, EV to EBIT of 6.2, EV to Free Cash Flow of 3.5, Price to Book of 1.1 with a Dividend Yield of 2.9%.
The second is a UK-based newspaper and magazine wholesaler trading at a bargain price of 5.4 times Earnings, Price to Free Cash Flow of 2.6, EV to EBIT of 4.7, EV Free Cash Flow of 3.4. It also has an attractive Dividend Yield of 7.5%.
North America – Nothing to do
No new recommendations this month as the index is below its 200-day simple moving average.
Asia – Sell Two – Hold One
No new recommendations this month as the Japanese index is below its 200-day simple moving average.
Sell Daiwabo Holdings Co., Ltd. (+6.8%) as it no longer meets the newsletter’s selection criteria.
Sell T.RAD Co., Ltd. (-4.7%) as it no longer meets the newsletter’s selection criteria.
Hold Shinwa Co., Ltd. (-0.1%) as it still meets the portfolio’s selection criteria.
Crash Portfolio – Buy One
One Crash Portfolio recommendation this month.
It is an undervalued Japan-based manufacturer and seller of medical electronic equipment trading at Price to Earnings ratio of 7.7, Price to Free Cash Flow of 8.4. EV to EBIT of 2.8, EV Free Cash Flow of 4.2.
Newsletter’s Performance
2022 was a wild year! If you just managed to hold on to your capital, not even making a profit it would have been a great performance.
My portfolio was down just under 6% for the year, not great, but I am very happy with the performance as well as the companies I am invested in.
In terms of the newsletter let’s start with how the ideas recommended in 2022 performed.
Performance of ideas recommended in 2022
This is how all the ideas recommended in 2022 performed:
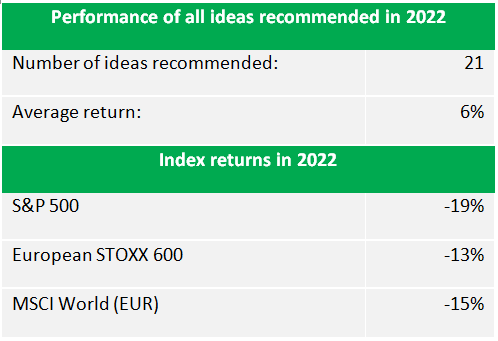
2022 newsletter returns compared to the indices
Despite the bottom falling out of markets world-wide the new ideas held up well, giving you a very acceptable positive return!
This is because fast growing overvalued companies have been punished the most and you know the newsletter only recommends quality undervalued companies.
The fact that the newsletter stops buying when markets fall has also helped you avoid losses this year.
Performance Since the Newsletter was Started in July 2010 – 12.5 years ago
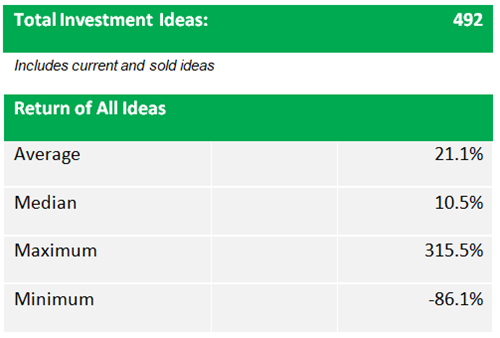
Loss of 86.1% occurred in before the Stop Loss system was implemented
How far the winners exceeded the losers – Over 3 to 1
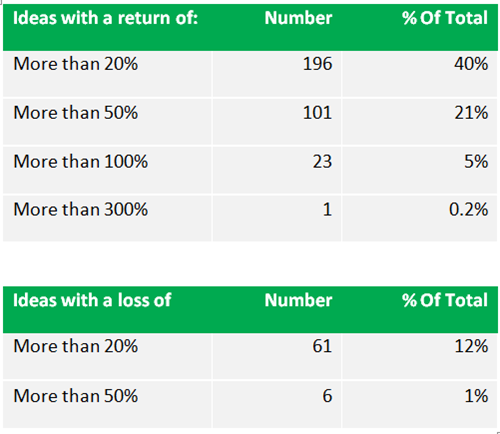
Over 3 times more winners over 20% than losers
As you can see the positive returns FAR outnumber the negative returns. For example, returns of more than 20% is 3.2 (196/61) times higher than losses of more than 20%.
This is because of three things:
- A great time-tested investment strategy
- The strict stop loss system
- Stop buying when markets fall
Dividend income
Even though we do not look at dividends when choosing ideas, an attractive dividend is an added bonus when you buy undervalued companies. You thus get paid to wait as stock prices increase.
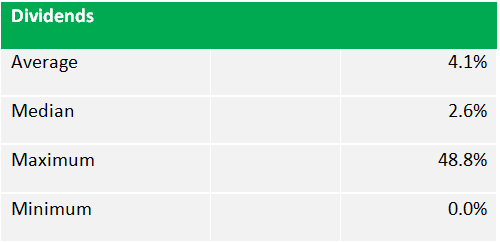
Average divided return of all ideas
Country performance
This is where companies were recommended and how they performed:
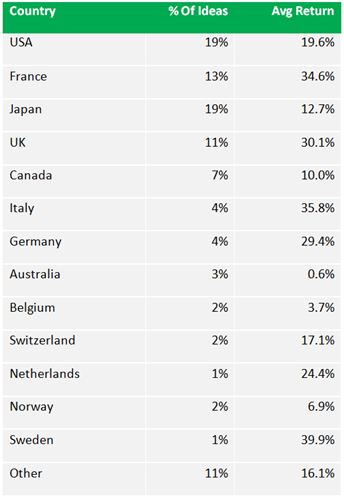
Where ideas were recommended and average return
How long are idea in the portfolio?
All ideas are analysed after a one year holding period to see if they still meet the newsletter’s Quality, Value and Momentum, investment criteria. This is how long companies stay in the portfolio:
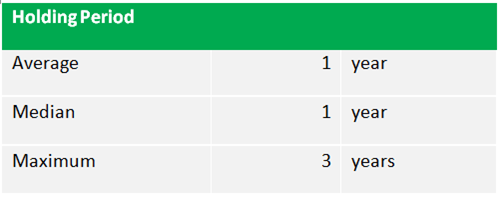
How long are ideas in the portfolio
Distribution of returns
You know investing works best when you cut your losses fast and let your winners run. This is how successful the newsletter has been at doing this.
The following two charts show you that 61%, just under two third of all ideas, would have given you a positive return, with the highest return of 315.5% (the second highest was +269.2%).
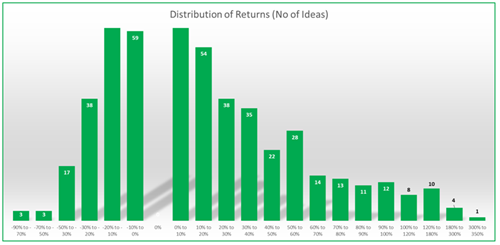
Distribution of newsletter returns – Number of companies
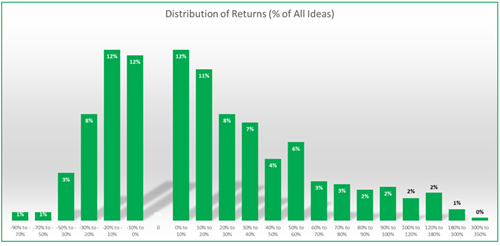
Distribution of newsletter returns – Percent of all ideas
The stop-loss system works!
And the stop loss system works.
Since March 2015, when it was implemented, only 10 of the 492 (2.0%) ideas lost more than 30%. This happened because of large sudden price drops, (before the stop-loss system can sell) for example, after a profit warning, legal action, stock suspension or fraud announcement.
The stop loss system lets you avoid the left-hand side returns (losses in the chart above).
This is very important because:
Firstly, you feel more comfortable investing, even in in companies you may not know. It is easier to get in if you know you can get out.
Secondly, you avoid the emotional pain of a large losses. This helps you stick to the investment strategy.
Not a subscriber? Click here to get ideas from the BEST strategies we have tested NOW!
