

This article shows you a really simple and easy to implement rule you can use to limit your losses. It is also a rule we added to the investment process of the Quant Value newsletter and something I use with my own portfolio.
This is the investment process we followed with the Quant Value newsletter to date:
- Each month the newsletter recommends companies based on the best investment strategies we have tested.
- If a company’s stock price has fallen more than the 20% from the highest point since we bought it (trailing stop loss) it gets sold – this makes sure you let your winners run and that you sell losing investments quickly to limit your losses.
Your investment process may be similar.
What worried me?
What has always worried me is what happens when markets start falling.
You know when markets fall they all fall together – in more technical terms – they become correlated.
This means, when markets are falling and you keep on buying, these investments will soon be sold because of the trailing stop loss system.
This is definitely not what we want!
Helpful research paper
Fortunately, I found a very interesting research paper by a great quantitative investor Mebane Faber called A Quantitative Approach to Tactical Asset Allocation.
In the paper Mebane wanted to find a simple method to improve the risk adjusted investment returns.
In other words he wanted to find a simple method to time the market.
Did it work?
What he found worked very well. It worked so well that he was able to get equity like returns with bond like volatility and draw-downs.
He achieved that through a simple moving average based trading rule.
What is a simple moving average?
A simple moving average (SMA) is the average of a company’s stock price over a certain time period – for example, the last 200 trading days.
How does it work?
In the paper this is what Mebane did to get the lower risk adjusted returns.
He applied the following simple strategy once a month on the last day of the month.
He invested in the S&P 500 if the current index price was higher than the index’s 200 day SMA and sold the index and moved to cash when the index fell below its 200 day SMA.
What you need to do:
- Buy when the index is above its 200 day SMA
- Sell and move to cash when the index is below its 200 day SMA
Just how well did it work? 110 years of data
Below is the chart of the strategy (the red line called TIMING) which he tested using the S&P 500 index over 110 year period from 1901 to 2012 (dividends and commissions for selling and buying were included).
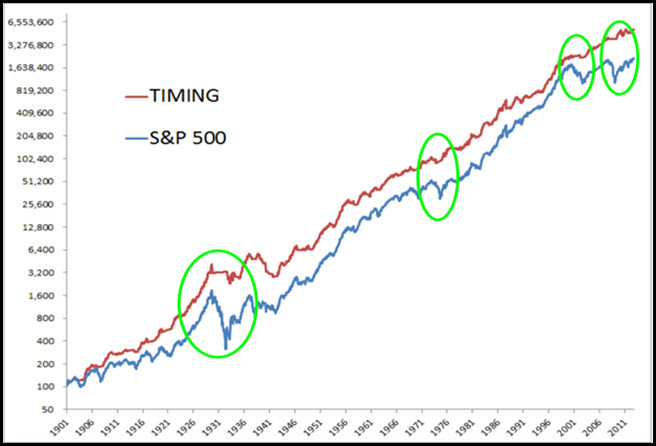
Source: A Quantitative Approach to Tactical Asset Allocation
As you can see the market timing line (TIMING) is a lot steadier with a LOT lower falls than the market.
For example, in 1920/1930 the market went down 83.66%, and the market timing strategy only lost 42.24%.
The strategy also avoided the internet bubble bear market in 2000 when the market went down by 44.73% and the financial crisis bear market of 2008-2009 when the S&P 500 fell 50.95%.
Just like any investment strategy it does not always work, for example in the 1940s the timing strategy had nearly the same draw-down as the market losing just over 50%.
Results shown in a table
The table below shows the results you saw in the chart above in table form. It shows the return of the S&P 500 compared to the timing model over the 110 years from 1901 to 2012.
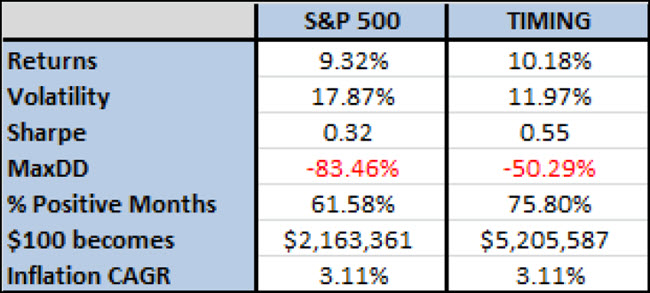
Source: A Quantitative Approach to Tactical Asset Allocation
You can clearly see the outperformance of the moving average strategy - mostly due to lower volatility and draw-downs.
Especially look at the lines:
MaxDD = Maximum draw down
$100 becomes = the end value of $100 invested in the two strategies over the period
It also works on the NASDAQ
He also tested the strategy on the NASDAQ Composite Index over 34 years from 1972 to 2006 – over this period the market timing strategy achieved a 4% annual outperformance while reducing the volatility by 25%.
Why must you be out of the market when it’s falling?
Another important result from the study is what happens when markets fall – and this is the biggest reason to be out of the market when it is going down.
Of the five markets they studied over the past 110 years they found that on average, the returns are 60% lower and the volatility 30% higher when the market is below its 200 day simple moving average.
The financial crisis in 2008 is a good example of this - volatility levels (large market movements) in stock markets around the world exploded to record levels. However, this volatility occurred after the markets already began declining.
Getting back to the newsletter.
Rule for the newsletter – Stop buying when the market is falling
After reading this paper I added the following rule to the newsletter’s investment system (and my own portfolio).
And the rule is:
Only buy if the moving average of the respective market index is above its 200 day simple moving average (SMA).
Here is an example
If the S&P500 index is above its 200 day SMA (and we can find good investment ideas) we will recommend investment ideas in North America.
If the S&P500 index is below its 200 day moving average no North American companies will be recommended because it means the market is falling.
Unlike in Mebane’s paper existing ideas will not be sold because with them we follow the strict 20% trailing stop loss system.
Summary
This is an idea I am sure you will find helpful. It is simple, easy to implement and as you saw it really does work.
Will it always work?
Of course not, just the same as with any investment strategy, it won’t but it works over long periods of time if you keep following it.
Remember a big part of investment success sticking to your investment strategy over the long term and that is where this rule can really help you because it protects you from extreme losses.
PS To get market beating investment ideas delivered to your inbox you can sign up right here
PPS It is so easy to forget. Why not do it right now before you get distracted - Sign up here
