

To help you get the best results using the Quant Investing stock screener I asked a few long time subscribers to show you how they use the screener.
In this article Domenico from Italy shows you how he implements a multi factor quantitative investment strategy.
[Comments in square brackets are mine]
Multi-factor quint investment strategy
My investment strategy includes two steps:
- Build a portfolio of around 30 to 35 global stocks, selected using a multi-factor model
- Implement an overlay through derivatives (futures and or CFDs) to change the net exposure of the portfolio (from 0% to +150%) based on a simple trend following / momentum model.
To implement your multi factor quantitative investment strategy - Click here
Data quality is very important
I use the Quant Investing stock screener for the first step of the strategy.
I tested other data vendors but I chose Quant Investing for:
- Its superior data quality (that's paramount: you can build the best model, but if data is garbage it's useless) and
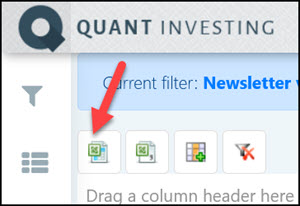
- The option to export large amount of data in Microsoft Excel. This gives me the flexibility to select the indicators I need and combine them in a flexible way.
[To export the results of your screen click the Export Data to MS Excel button]
I use these ratios and indicators to get ideas
In detail, the two main factors I use are:
- Value - I build my own composite value ranking in Excel with the following ratios:
- Price to Book,
- Price to Sales,
- Enterprise Value to EBIT,
- Enterprise Value to EBITDA,
- Enterprise Value to Free Cash Flow
- Momentum - I also build my own momentum indicator in Excel using different periods from 3 to 12 months.
I assign smaller weights to these three factors:
- Yield (shareholder yield, change in total assets, external finance)
- Quality (mainly profitability, but also leverage and accruals)
- Low volatility
I avoid stocks with large or increasing short selling amounts.
[You can do this with the two ratios Short Int % and Short Int % Change – currently only available for the US market]
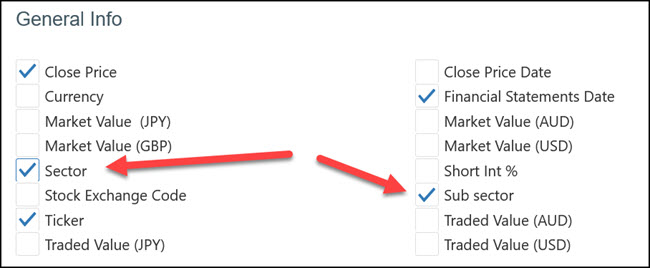
Some factors (value, quality and yield) have historically produced better risk-adjusted returns if calculated on an intra-sector basis. Working with excel gives me the flexibility to do that.
[To do this make sure you add the Sector and Sub Sector fields to the data you export to Excel.]
All fees and taxes are considered
After combining the different factor scores of each stock (value and momentum) into one total score, I convert it into an expected return, net of trading fees on different exchanges, Tobin taxes (currency transaction taxes), double and withholding taxes on dividends etc.
I then select the stocks with the highest expected net return, given some geographic and sector concentration limits I put in place.
To implement your multi factor quantitative investment strategy - Click here
A final check before buying
As I said, I find the quality of the data provided by the Quant-Investing screener satisfactory, but before buying a stock I perform several manual checks, of which the most important are:
- Is data correct?
- Are the ratios and indicators affected by one-off transactions and events (sale of non-core assets, special dividends)?
- Is the company currently part of a takeover/merger?
[For more information on additional research we suggest you do read this article: This is how we select ideas for the Quant Value newsletter]
Frequently Asked Questions (FAQs) For Investors Using a Multi-Factor Quantitative Investment Strategy
1. What is a multi-factor quantitative investment strategy?
A multi-factor quantitative investment strategy uses different financial ratios and indicators to pick stocks.
It combines factors like value, momentum, quality, yield, and low volatility to find the best investments.
2. How do I start building a multi-factor portfolio?
Start by using a stock screener like Quant Investing to find stocks that match your criteria. You can export the data to Excel, where you can combine even more factors like price-to-book, price-to-sales, and momentum to create a composite score for each stock.
3. What factors should I consider when picking stocks?
Consider factors like value (Value Composite Two, Quant Value Composite, price-to-book, price-to-sales), momentum (stock price changes over 3 to 12 months), quality (profitability, leverage), yield (dividend yield), and low volatility. These factors help identify strong investment opportunities.
4. How do I use Excel to improve my stock selection?
Use Excel to calculate and combine different financial ratios. You can create a composite score that reflects your investment strategy. Excel also allows you to compare stocks within the same sector, which can improve your stock picks.
5. How do I ensure the data I use is reliable?
Reliable data is crucial. The Quant Investing stock screener provides high-quality data.
Important: Before buying a stock, manually check if the data is correct and not affected by one-off events like asset sales or special dividends.
6. What should I check before buying a stock?
Before buying, check if the data is accurate and whether any ratios are affected by unusual events. Also, check if the company is involved in a takeover or merger. These checks help avoid bad investments.
I hope you have found the article helpful and special thanks to Domenico for sharing his strategy.
PS To implement multi factor quant strategies in your portfolio sign up here
PPS It is so easy to put things off, why not sign up right now? It costs less than a cheap lunch for two each month and if you don’t like it you get your money back.
To implement your multi factor quantitative investment strategy - Click here
