

Learn to implement a low price to book value investment strategy in your portfolio and discover how to significantly increase its returns through extensive back-testing we have done.
This post provides a step-by-step guide, showing that low price to book strategies are effective not just in the USA but also in Europe. You'll also learn why using the book to market ratio is more reliable and how to screen for undervalued companies.
You can also see how to add powerful combinations with other ratios, such as momentum and the Piotroski F-Score, to maximize your returns.
Estimated Reading Time: 8 minutes
First a bit of background information…
Price to book - the most tested value ratio
The price to book ratio is probably the most tested valuation ratio there ever.
This is because price to book data is available for long periods of time. It has thus been easy for investors, university professors and students to get hold of the data and test it in all possible ways.
Does a low price to book strategy also work in Europe
You know that a low price to book investment strategy works in the USA as most of the past back tests and academic research papers have been done using data from the US markets.
But does it also work outside the USA?
In 2012 that is exactly what we wanted to find out when we tested the Price to book investment strategy in Europe over the 12 year period from June 1999 to June 2011.
This is what we tested
The back-test universe was about 1500 companies in the 17 country Eurozone markets over the 12-year test period (13 June 1999 to 13 June 2011). We excluded banks, insurance companies, investment funds, certain holdings companies, and REITS.
We included bankrupt companies to avoid any survivor bias, and excluded companies with an average 30-day trading volume of less than €10 000. For bankrupt companies, or companies that were taken over, returns were calculated using the last stock market price available before the company was delisted.
This is what we found:
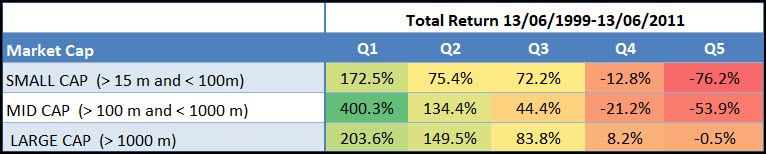
Low price to book returns in Europe from June 1999 to June 2011 by company size.
Source: Quantitative Value Investing in Europe: What works for achieving alpha
As you can see companies with the lowest price to book value, quintile 1 (Q1) did a lot better than companies with a high price to book ratio (Q5).
And it did this for small, medium and large companies.
Also note that the returns all decline from Q1 to Q5. This mean that it is a good valuation ratio to use because the lower the price to book ratio the higher the returns.
The lowest price to book value companies all substantially outperformed the market which returned only 30.54% over the same 12 year period.
The best performers were Mid Cap companies which increased 369.8% better than the market.
Click here to start finding LOW Price to Book companies for your portfolio NOW!
Why you should use book to market NOT price to book
When screening for investment ideas we recommend that you use the book to market value ratio and not the price to book ratio.
The reason is simple - book to market gives you better results.
That is also the reason why you see that all academic research studies use the book to market ratio.
How it’s calculated
The price to book ratio is calculated as Market value / Book value.
The book to market ratio is calculated as - Book value / Market value (or Book value per share / Share price). It is simply the inverse (the opposite) of the price to book ratio.
Why book to market works best
But why does the book to market value give you better results, you may be thinking.
The reason is because some companies have a negative book value.
If you used the price to book ratio, the lower the value the more undervalued the company is.
But if the company's book value is negative it will make the price to book value negative.
Now if you look for companies with the lowest price to book value (most undervalued companies) those with a negative price to book value will be the first on your list.
Not what you are looking for
And this is not what you are looking for.
The book to market ratio on the other hand works just the other way around. The higher the book to market value of company is the more undervalued the company is.
So low price to book companies = high book to market value companies. This may be difficult to get used to at first but you will soon feel comfortable with it.
Negative book value does not matter
With the book to market ratio it does not matter if a company has a negative book value.
This is because, to find undervalued companies, you are looking for companies with the highest book to market value.
If the book value of the company's negative it will have a negative book to market value and the company will not show up in your results.
This is what you are looking for.
Why negative book value?
Why do companies have a negative book value?
One reason is that they wrote off a large amount of goodwill and the resulting loss wiped out the book value of the company or the company made large losses in the past which completely wiped out its equity or book value.
I'm sure you can also think of a few other reasons.
Click here to start finding LOW Price to Book companies for your portfolio NOW!
How to screen with the book to market ratio
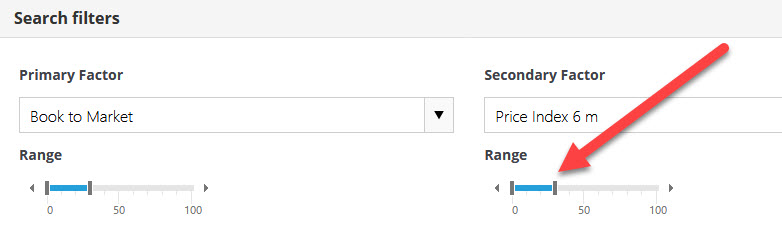
In the Quant Investing stock screener when looking for companies that are undervalued in terms of price to book value use the book to market value ratio as your primary factor.
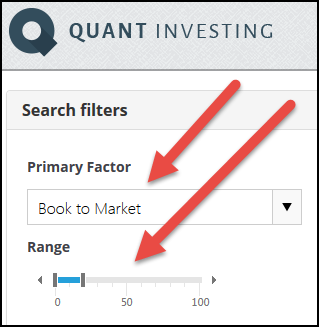
If you set the slider from 0 to 20% (as shown above) it will give you a list the 20% most undervalued companies.
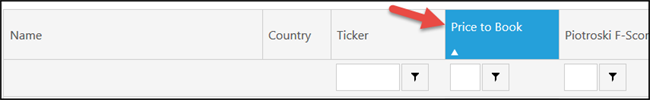
If you prefer price to book
If you prefer to see your results as price to book value simply select price to book as one of your output columns.
You can then sort this column from low (the most undervalued companies) to high to find the most undervalued companies.
Give the book to market ratio a try, it will see it gives you better investment ideas.
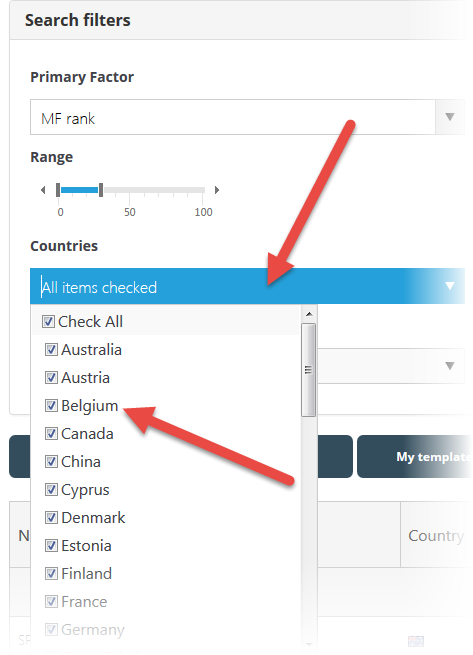
Select your countries
The next step is for you to select the countries where you would like to find investment ideas.
To do this click the drop down list item below Countries and check all the countries you would like to select.
Select value and volume
Next you have to choose the minimum daily trading volume and the minimum market value of the companies you want to screen for.
Please note the numbers you enter are in thousands, this means if you enter $100 it is equal to $100,000.
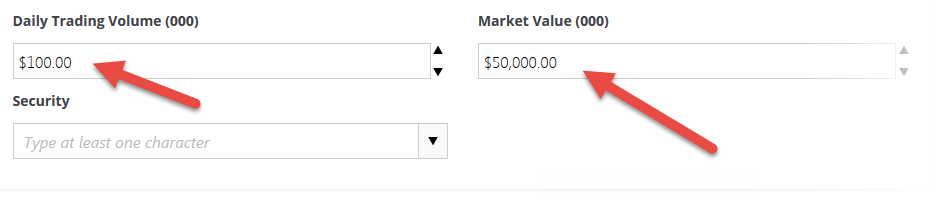
That is all you have to do.
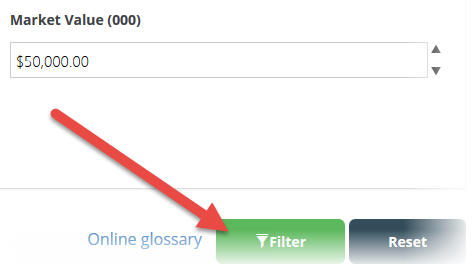
When you are done click the Filter button to get your investment ideas.
BUT Price to book can be improved - a lot +692%
As mentioned you can improve the returns of the Price to book a lot, up to 692.1% in the testing we have done.
We tested the Price to book investing strategy with 13 other ratios and as you can see in the table below the returns of the strategy can be substantially improved.
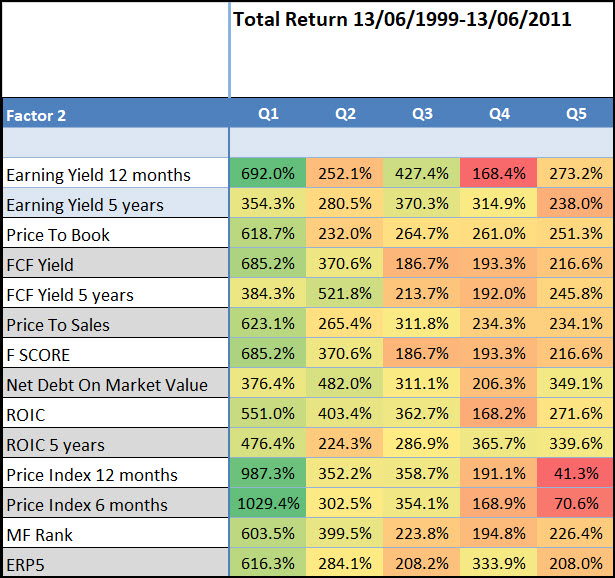
Price to book returns when combined with a second ratio tested in Europe from June 1999 to June 2011.
Source: Quantitative Value Investing in Europe: What works for achieving alpha
Look at column Q1
Look at the returns in column Q1, it shows the returns generated by first selecting the 20% lowest Price to book companies combined with the ratios in the column called Factor 2.
Best combination +1029% was Momentum (692.1% improvement)
This means you could have earned the highest return of 1029.4% over the 12 year period if you invested in the best ranked Price to book companies that also had the highest Price Index 6 months (share price momentum).
This is a 692.1% improvement over the best return of 400.3% you could have earned if you used only the Price to book to get investment ideas.
What is Price Index 6 months?
Price Index 6 months is calculated as Current share price / Share price 6 months ago.
It's thus a ratio that shows the return of a share price over the past six month period. A ratio > 1 shows that there's been a price increase over the period whereas a ratio < 1 shows that there has been a price decrease.
Other great combinations
Other good combinations from the table above are:
- Price to book and 12m Price index (momentum) +987.3%
- Price to book and Earnings Yield 12 months (EBIT/EV) +692%
- Price to book and FCF Yield(FCF/EV) +685.2%
- Price to book and the Piotroski F-Score +685.2%
Click here to start finding LOW Price to Book companies for your portfolio NOW!
How to combine the Price to book with other ratios
With the screener it is very easy to combine the Price to book ratio with other ratios or indicators. The following screen shots will show you exactly how.
First select the book to market ratio, then select the Countries, Daily Trading Volume and minimum Market Value as shown above.
How to add 6 month Price Index (momentum)
To add Price Index 6m (6m momentum) to the screen click the drop down list below Secondary Factor and, under the heading Momentum click in the Price Index 6 m menu item.
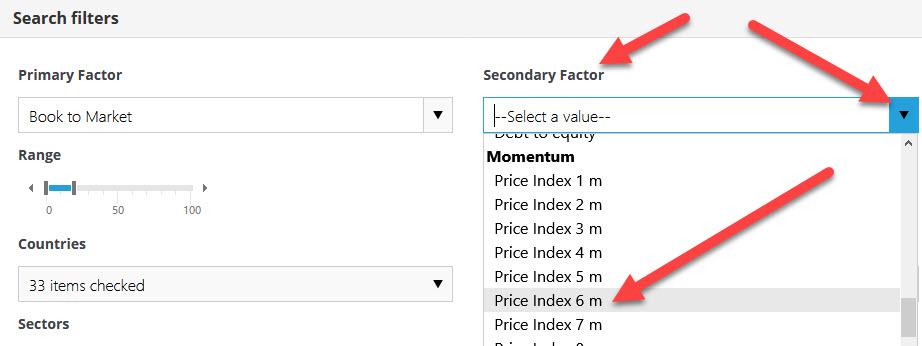
Click image to enlarge
Move the slider below Price Index 6m so that you select the top 20% of companies with the best six month Price Index.
Lastly click the Filter button so the screener can find the companies you are looking for.
In the same way you can add the following ratios:
- Price index 12m (momentum) +987.3%
- Earnings Yield 12 months (EBIT/EV) +692%
- FCF Yield(FCF/EV) +685.2%
- Piotroski F-Score +685.2%
And many more (you can see all ratios and indicators you can use in the Glossary)
You can save all your screens
Once you have set up your book to market (Price to book) screen to fit your investment style you can save it so that you can call it up at any time.
You can save as many screens as you like.
To save your screen click the My template button, then the Save to template menu item.

In the pop-up box give your screen a name and a short description so you can remember what types of companies it looks for.
But be VERY careful of the price to book ratio
We recommend that you never use a single ratio to get investment ideas.
That is also the reason we designed the screener with four sliders which allows you to quickly and easily combine up to four ratios and indicators (you can use even more if you use column filters) to select investment ideas.
An investor I respect confirmed this
This advice was confirmed when I found a very interesting article by James O'Shaughnessy (author of the book What Works on Wall Street) called Price-to-Book Value Ratios: A Long-Term Winner with Long Periods of Underperformance.
Price to book does not always work
As I mentioned a lot of books and research reports show you how low price to book ratio (undervalued) companies outperform high price to book (expensive) companies over long periods of time.
However when James O'Shaughnessy looked at the returns from a price to book investment strategy in the USA for the 36 year period from 1927 to 1963 the 10% of companies with the lowest price-to-book value ratios was the worst performing of all the deciles (10% groups) he tested.
What was surprising was that decile two (10% to 20%), three (20% to 30%), four (30% to 40%) and five (40% to 50%) of all companies ranked by price to book ratio, all outperformed the market.
This means that companies with a low price-to-book value did well, but not those with the lowest price to book ratio.
In summary how this information can increase your returns
In the article James O'Shaughnessy gives three lessons you can learn from the unexpected underperformance of the lowest price to book companies:
- Be very careful of back test studies that cover only a short period of time.
- It is not always the lowest rankings of a value ratio that gives you the best returns.
- The underperformance shows the danger of relying on a single ratio or indicator when selecting investment ideas. To correct for this take a look at the Value Composite One indicator that James created and tested or how you can combine the price to book ratio with the Piotroski F-Score to select better quality companies.
Click here to start finding LOW Price to Book companies for your portfolio NOW!
Please read the article yourself
Even though I did my best to give you a good summary of James’ article I suggest that you read the complete article by clicking on the following link Price-to-Book Value Ratios: A Long-Term Winner with Long Periods of Underperformance
More research on low price to book companies
James published a further very interesting article on the price to book ratio called The Very Cheapest Stocks (Price/Book) Do Very Badly.
In the article he tested the returns you could have achieved if you used a strategy of only buying very cheap (undervalued) price to book companies.
What he found was unusual…
Concentration is bad for you
If you buy only a few low price to book value companies you may as well buy an index fund as you are not going to outperform the market.
If you are going to buy low price to book companies you have to buy a basket of at least 25 companies, and if you buy 100 companies you will perform even better.
The following chart shows you how various portfolios of low price to book companies performed against the market.
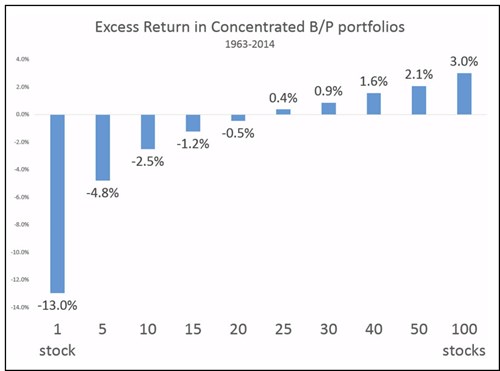
Source: The Very Cheapest Stocks (Price/Book) Do Very Badly
Really bad under-performance
As you can see if you owned a small number of low price to book companies (-13.0% left on the x-axis) you would not have done well at all.
For example if you owned only five of the lowest price to book companies your returns would, on average have, been nearly 5% worse than the market per year for the whole 51 year test period.
That is really bad, something you want to avoid at all costs.
Combining price to book with the Piotroski F-Score +685.2%
Another price to book strategy you should take a serious look at is combining low price to book companies with a quality indicator called the Piotroski F-Score. It is called F Score in the above table.
As you saw above the Price to book and the Piotroski F-Score strategy would have given you the fourth best return of +685.2%.
It was not the best performing strategy, it was the fourth best but don’t let that worry you.
The highest return strategy is not the one you should be looking for but the one that has been tested the most over the longest possible test periods in different markets. And that is exactly what has happened with this strategy.
The Piotroski research paper
In 2000 an unknown accounting professor from the University of Chicago wrote a very interesting research paper called "Value Investing: The Use of Historical Financial Statement Information to Separate Winners from Losers".
He wanted to see if he can develop a ranking system (using a simple nine-point scoring system) that can (referred to in the paper as high book to market) value companies.
What he found
What he found was something that exceeded his most optimistic expectations.
Buying only those companies that scored highest (8 or 9) on his nine-point scale, or F-Score as he called it, over the 20 year period from 1976 to 1996 led to an average outperformance over the market of 13.4%.
This is truly outstanding if you remember that 80% of investment funds do not even beat the index.
Even more impressive were the results of a strategy of investing in the highest F-Score companies (8 or 9) and shorting companies with the lowest F-Score (0 or 1).
Over the same period from 1976 to 1996 (20 years) this strategy led to an average yearly return of 23.0%, substantially outperforming the average S&P 500 index return of 15.83% over the same period.
This average outperformance of the market of just over 7% per year may not seem like much but over the 20 year period an investment of 100 in this long short strategy would have grown to 6,282 compared to an amount of only 1,860 if you invested in the S&P 500 index. The difference between these two rates of return over the 20 year period is over 44 times your initial investment!
How is the Piotroski F-Score calculated?
The Piotroski F-Score is calculated with the use of the following 9 ratios;
Profitability
1. Return on assets (ROA)
Net income before extraordinary items for the year divided by total assets at the beginning of the year.
Score 1 if positive, 0 if negative
2. Cash flow return on assets (CFROA)
Net cash flow from operating activities (operating cash flow) divided by total assets at the beginning of the year.
Score 1 if positive, 0 if negative
3. Change in return on assets
Compare this year’s return on assets (1) to last year’s return on assets.
Score 1 if it’s higher, 0 if it’s lower
4. Quality of earnings (accrual)
Compare Cash flow return on assets (2) to return on assets (1)
Score 1 if CFROA>ROA, 0 if CFROA<ROA
Funding
5. Change in gearing or leverage
Compare this year’s gearing (long-term debt divided by average total assets) to last year’s gearing.
Score 1 if gearing is lower, 0 if it’s higher.
6. Change in working capital (liquidity)
Compare this year’s current ratio (current assets divided by current liabilities) to last year’s current ratio.
Score 1 if this year’s current ratio is higher, 0 if it’s lower
7. Change in shares in issue
Compare the number of shares in issue this year, to the number in issue last year.
Score 1 if there is the same number of shares in issue this year, or fewer. Score 0 if there are more shares in issue.
Efficiency
8. Change in gross margin
Compare this year’s gross margin (gross profit divided by sales) to last year’s.
Score 1 if this year’s gross margin is higher, 0 if it’s lower
9. Change in asset turnover
Compare this year’s asset turnover (total sales divided by total assets at the beginning of the year) to last year’s asset turnover ratio.
Score 1 if this year’s asset turnover ratio is higher, 0 if it’s lower.
Piotroski or F-Score = 1 + 2 + 3 + 4 + 5 + 6 + 7 + 8 + 9
Good or high score = 8 or 9
Bad or low score = 0 or 1
How you can best use the Piotroski F-Score
As you can see from the way the Piotroski F-Score is calculated it is really a measurement of the quality of a company.
Or said in a different way it is a measurement of the fundamental momentum of a company.
The F-Score, because it tells you nothing about the valuation of the company, is best used along with another valuation measure such as price to book ratio (as a first screening measure) where after you use the Piotroski F-Score to select only quality companies.
Click here to start finding LOW Price to Book companies for your portfolio NOW!
It also works in Europe
As you saw in the research paper above the Piotroski F-Score also works in Europe.
Here are the results again.
If you only used Price to Book
The table below shows the returns you could have earned if you only used a low Price to Book value strategy to invest in Europe over the 12 year period 13 June 1999 to 13 June 2011.
Source: Quantitative Value Investing in Europe: What works for achieving alpha
Q1 (Quintile 1) represents the cheapest 20% of companies in terms of Price to Book ratio and Q5 (quintile 5) the most expensive.
The strategy worked well as the lowest Price to Book companies (Q1) substantially outperformed the market, which over the same 12 year period returned 30.54%.
Price to Book with Piotroski F-Score
If you combined the low Price to Book strategy with the 20% of companies with the best (highest) Piotroski F-Score the following tables shows what your return would have been over the same 12 year period.
Source: Quantitative Value Investing in Europe: What works for achieving alpha
To get the above results we first selected the 20% of companies with the lowest Price to Book ratio.
We then, using the ratios and indicators in the column called Factor 2, sorted these companies into five quintiles (20% groups), quintile one (Q1) was the most undervalued and quintile 5 (Q5) the most overvalued.
An 284.9% improvement
You can see that if you selected only the best Piotroski F-Score companies the return of your low Price to Book ratio investment strategy would have increased from 400.4% to 685.2% (Row: F Score Column: Q1), an improvement of 284.9% over the 12 year period.
The Piotroski F-Score improved every strategy
In the research paper selecting the best Piotroski F-Score companies not only improved the returns of a low Price to Book strategy it also improved the returns of all other strategies.
For example:
- Returns from a high Earnings Yield strategy was increased from 236.3% to 447.1% (+210.8%)
- Returns from a high Free Cash Flow Yield strategy was increased from 317.4% to 568.7% (+251.3%)
- Returns from using Joel Greenblatt’s Magic Formula was increased from 182.8% to 349.0% (+166.2%)
How to use the Piotroski F-Score to get investment ideas
This is how you can screen for low price to book ratio (high book to market ratio which is the inverse of price to book) screen with a high (good) Piotroski F-Score.
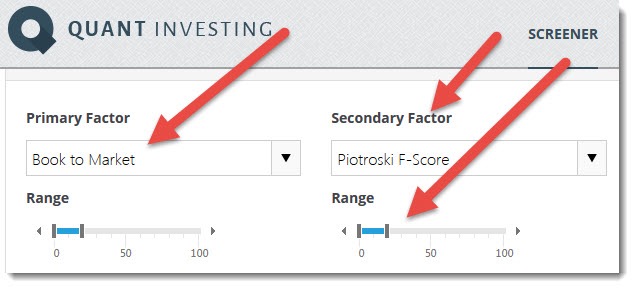
You can of course use any other valuation ratio and even add two other criteria with the two further sliders the screener offers you.
Not wildly popular
What is really remarkable is that, in spite of the substantial benefits the F-Score can add, it has not been taken up more widely by investors and the asset management profession.
I strongly suggest that you give the Piotroski F-Score a try, as the above evidence show, it will substantially increase your investment returns, irrespective of what investment strategy you follow.
Summary and conclusion
This has been a rather long article to show you that:
- Price to book ratio is a good ratio you can use to find undervalued companies
- But it has periods where it underperforms the market
- The lowest price to book companies may not be the best investments
- The performance of the price to book ratio can be improved a lot by adding a second ratio, for example Price index 6 months
- You can use the Piotroski F-Score to screen out low price to book companies with bad fundamental momentum (quality)
Your Price to book analyst
Wishing you profitable investing
Click here to start finding LOW Price to Book companies for your portfolio NOW!
PS: Need a tool to get all of the above ratios and indicators to give you investment ideas? Click here to sign up now
PPS: Don’t hesitate, you have nothing to lose. If you are not 100% satisfied you get your money back – no questions asked.
PPPS: It's so easy to put things off why not sign up right now!
