

Estimated Reading Time: 6 minutes.
In this post, you’ll learn how to quickly compare companies using the Quant Investing Stock Screener. It walks you through creating customized templates with key financial ratios, building watchlists, and analysing the comparison results.
It helps you to quickly compare stocks, making your investment decisions more informed and precise. By the end, you’ll know how to tailor the screener to your specific needs, allowing you to make smarter stock picks effortlessly.
After a few subscribers asked for a feature to compare companies in the screener we thought we needed to add it. However, when speaking to our programmer he said it’s very easy to do and we have everything available already.
So here is how you do it!
How to compare companies using the Quant Investing Stock screener
Before you choose companies
Before you choose the companies to compare spend a minute to think about what ratios and indicators you would like to see.
You can use all the ratios and indicators in the screener to compare. A quick reminder, the glossary contains a list of all the ratios and indicators in the screener.
Put your template together
Once you've selected the ratios save them as a Template.
A Template is a saved group of ratios (in the sequence you want them) you can load with a few mouse clicks.
You don't have to limit yourself to one template, you can save as many as you like. For example, you can create Templates with:
- Valuation ratios
- Momentum ratios
- Quality ratios
In the example below you will see one template that contains all the ratios I would like to use.
For instructions on exactly how to create and save Template look at the following article: How to create and edit Templates in the Quant Investing stock screener
After you've saved your Template you can select the companies.
Create a watch list with all companies
The easiest way to compare companies is to create a Watchlist.
You also don't have to limit yourself to one, you can create as many as you like. For detailed instructions on how you to create and edit watch list see the article: How to create and edit Watchlists in the Quant Investing stock screener
Company Comparison Example
Here is an example of everything you can do with the comparison function.
Template example
I created a Template called Comparisons with all the ratios grouped together as you will see below.
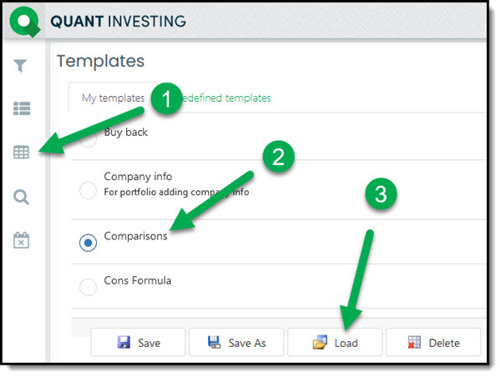
To load the Template simply:
- Click the Templates icon
- Click to select the Template
- Click the Load icon
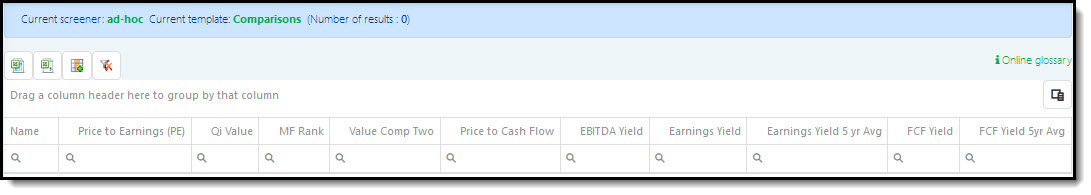
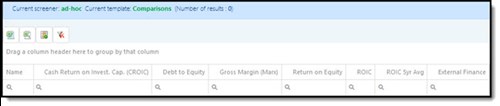
This is what the template looks like.
Valuation Ratios
Click image to enlarge
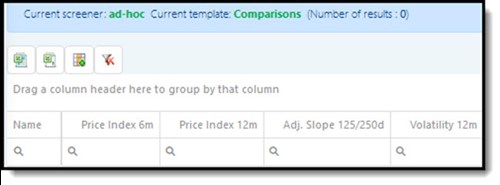
Momentum ratios
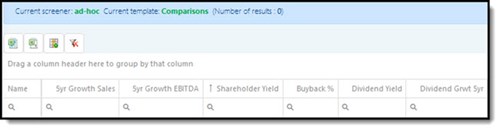
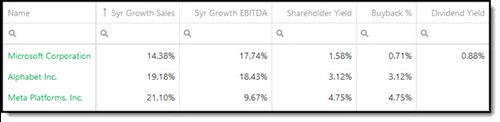
Growth and return ratios
Quality Ratios
I've shown the template in four images as it’s too wide to show in one screenshot.
List of companies to compare - Watchlist
The next step is to load the Watchlist of the companies to compare. I selected a few large tech companies.
You can create your own list of companies which can also be your current portfolio.
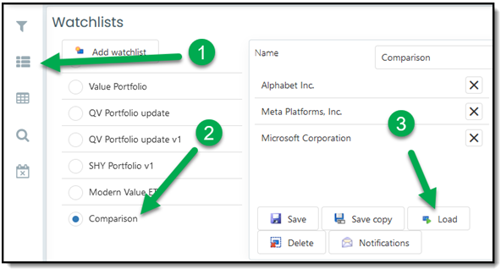
To load the Watchlist simply:
- Click the Watchlist icon
- Click to select the Watchlist
- Click the Load icon
To start comparing all the companies you want NOW! - Click here
Comparison results
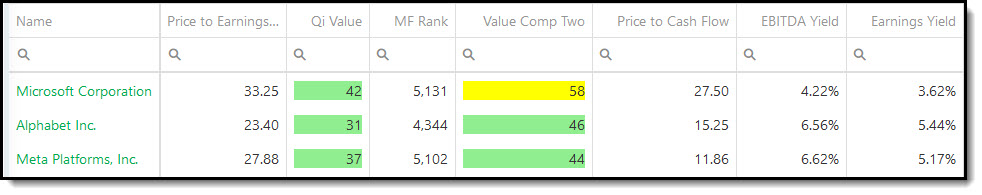
This is what the comparison results look like:
Valuation ratios:
Momentum ratios:
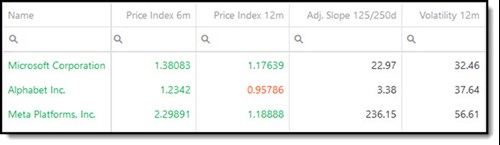
Growth ratios:
Quality ratios:

More comparison information in the company dashboard
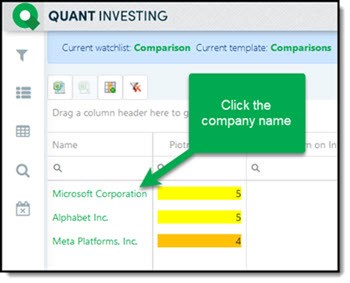
You can get additional comparison information in the company dashboard.
Click on any company name to go to the dashboard page.
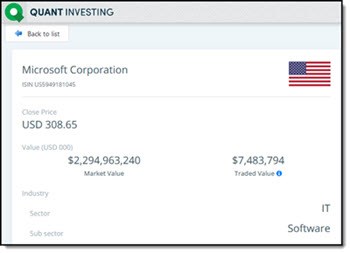
This is what the dashboard looks like:
Scroll down to go to the bar charts that look like this:
The charts work better if you are comparing a lot of companies, but I will use this example to give you an idea of how to use it.
Value Composite One comparison
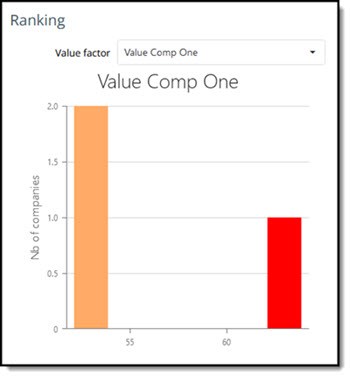
Chart explanation:
The company you clicked on is shown in red - Microsoft in this example.
X-Axis (horizontal) shows the values of the ratio selected in the drop-down list - Value Comp One
Y-Axis (vertical) shows the number of companies with the same ratio value.
In this example: Microsoft (in red) has a Value Comp One value over 60. Meta Platforms and Alphabet (in orange) have values of 46 and 44 so they are grouped together.
You can thus see Microsoft is a more expensive than the other two companies based on Value Composite One.
Debt to Equity comparison
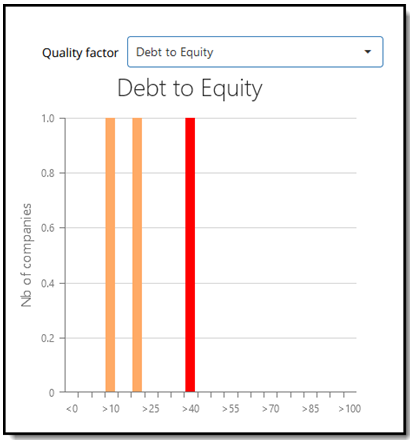
Here you can see Microsoft has higher Debt to Equity ratio than the other two companies.
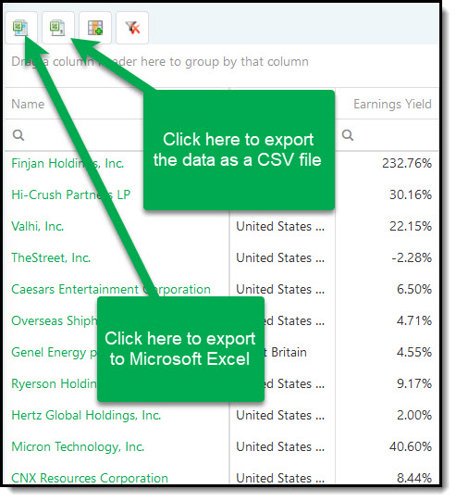
Export to Excel and CSV
You can of course export all the values you see in the screener to Excel or as a CSV file.
To do this just click on the two icons shown below.
Summary and conclusion
That is how easy you can compare as many companies as you like using all the ratios and indicators you want to see.
If you need help just click the “Need help?” button at the bottom right of your screen.
Frequently Asked Questions
1. How do I start comparing companies?
Start by choosing key financial ratios and indicators. Use these to create a template that fits your needs.
2. What ratios should I focus on?
Focus on valuation, momentum, growth, and quality ratios. These give a well-rounded view of a company's performance.
3. Can I compare companies in different industries?
Yes, but adjust your ratios to account for industry-specific differences.
4. How do I save my comparison settings?
Save your selected ratios as a template. You can create multiple templates for different comparisons.
5. What if I want to track these companies over time?
Create a watchlist with your selected companies and monitor their performance over time.
6. Can I export my comparison data?
Yes, you can export the data to Excel or CSV for further analysis.
7. How do I visualize my comparison results?
Use the dashboard to view bar charts and other visual tools that make comparison easier.
8. How often should I update my templates?
Regularly review and update your templates as you think of better ratios or indicators to compare companies with.
9. Can I compare companies already in my portfolio?
Yes, add your portfolio companies to a watchlist and compare them directly within the screener.
10. What’s the quickest way to get started?
Create a template with basic ratios, add companies to a watchlist, and start comparing immediately.
To start comparing all the companies you want NOW! - Click here
